Download
1 / 38
390 likes | 486 Views
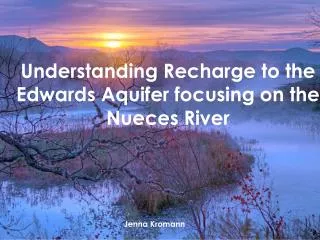
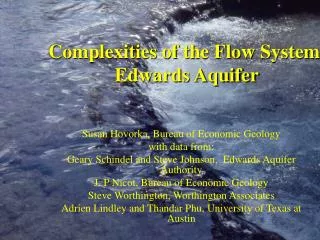
Land-Applied Wastewater Effluent Impacts on the Edwards Aquifer. by: D. Lauren Ross, Ph. D., P. E. Glenrose Engineering, Inc. 512.326.8880 glenrose.com. Acknowledgements:. City of Austin U.S. Geological Survey BS/EACD LCRA. Fragile Streams. Naturally low flow Naturally low nutrients.

E N D
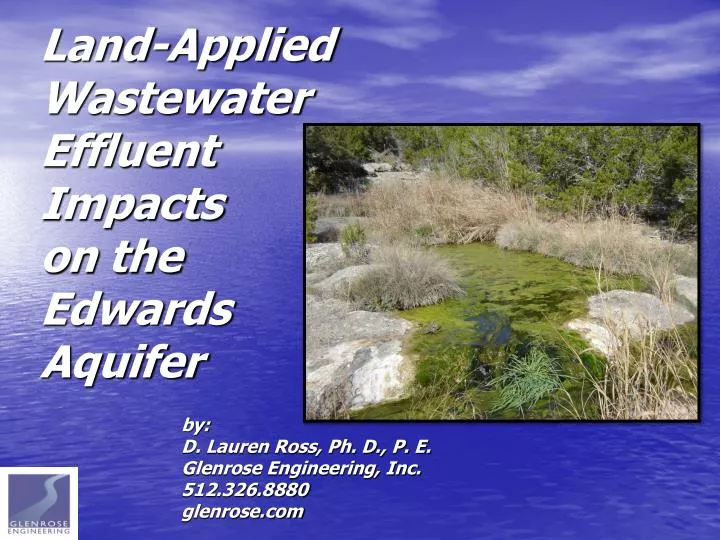
Land-Applied Wastewater Effluent Impactson the Edwards Aquifer by: D. Lauren Ross, Ph. D., P. E. Glenrose Engineering, Inc. 512.326.8880 glenrose.com
Acknowledgements: • City of Austin • U.S. Geological Survey • BS/EACD • LCRA
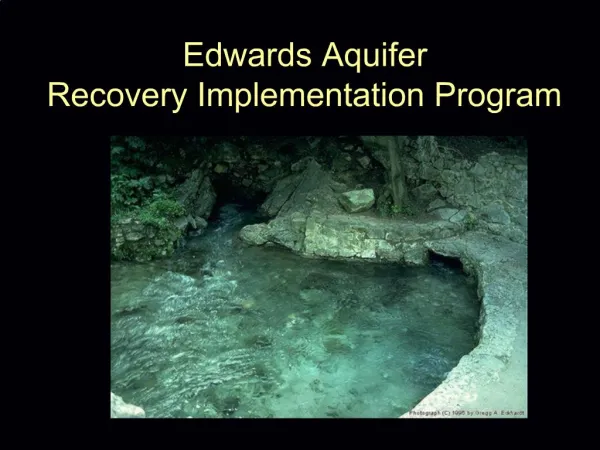
Fragile Streams • Naturally low flow • Naturally low nutrients
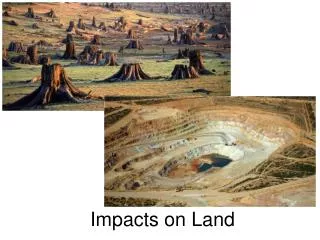
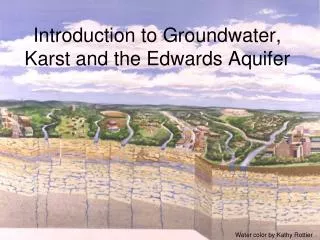
Fragile Aquifer • Rapid Flow • No Filtration • Recharged through both Upland and Stream Features
Texas Land Application Permits in the San Antonio and Barton Springs Edwards Aquifer Recharge Zones NONE
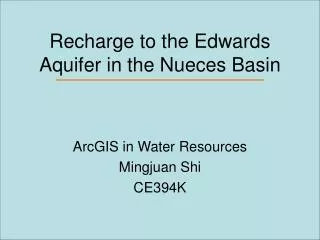
Texas Land Application Permits in the San Antonio and Barton Springs Edwards Aquifer Contributing Zones 67
Texas Land Application Permits San Antonio and Barton Springs Edwards Aquifer Contributing Zones Barton Springs Edwards Aquifer Contributing Zone: 26 San Antonio Edwards Aquifer Contributing Zone: 41
24 Times the TLAPed Effluent in the Barton Springs Compared to the San Antonio Edwards Aquifer Contributing Zones on an Area Basis
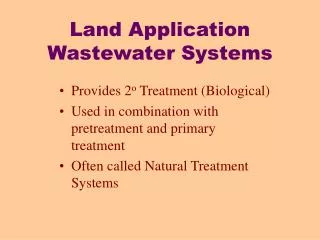
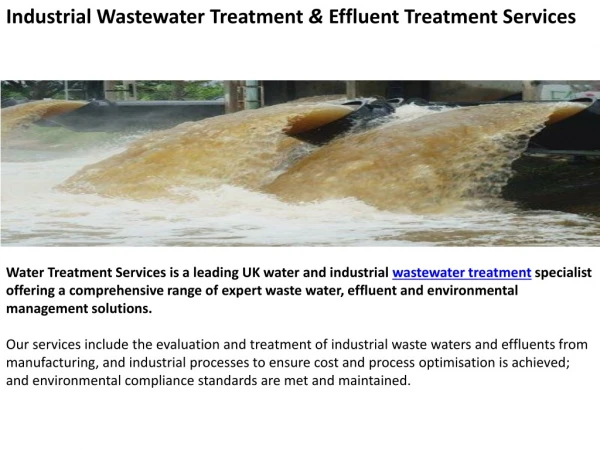
What Determines A Protective TLAP? • Effluent Treatment Technology • Effluent Treatment Standards • Effluent Storage Requirements • Irrigation Area Requirements
Different Effluent Treatment Technologies • Activated Sludge: 44 (70%) • Membrane Bioreactor: 2 (3%) • Others: • Facultative Lagoon • Septic Tank • Not Specified (2)
Widely Different Effluent Standards • Daily Average BOD and TSS Range from 5 to 30 mg/l • 16 have no effluent limits • Only 10 with nutrient limits • Only 2 with total nitrogen limits
Widely Different Effluent Storage Requirements • 21 Systems with no storage requirement • Required Days Storage Ranges from 0.08 to 308 Days • Average for Subsurface Irrigation: 5.8 Days • Average for Surface Irrigation: 70 Days
Widely Different Effluent Irrigation Area Requirements • Application Rates Range from 0.08 to 12.20 acre-feet per acre per year • The most common rate is 4.88 acre-feet per acre per year (0.1 gal/day/sf)
Evidence of Stream Degradation • No Monitoring Requirements • Nutrients are Most Mobile • Compounding and Confusing Nutrient Sources • Nutrients can “disappear” out of the water column into algae growth
Nitrate Concentration in Barton Creek Canyons Baseflow (COA, 1997)
Degradation Evidence: Barton Creek West Increasing Nitrate Concentrations in Scenic Bluff Springs Over Time
Degradation Evidence: West Cypress Hills Algae in East Lick Creek Downstream from Pedernales Canyon Trail West Lick Creek Downstream from Pedernales Canyon Trail
Degradation Evidence: West Cypress Hills Broken Effluent Irrigation Pipe
Degradation Evidence: West Cypress Hills Broken Effluent Irrigation Pipe
Degradation Evidence: West Cypress Hills Lick Creek Below Broken Effluent Irrigation Pipe
Degradation Evidence: West Cypress Hills Algae Down Stream from Effluent Irrigation
TLAP Noncompliance • Failure to Monitor Soil: Only 2 of 64 TLAPs with reported data • Application Misinformation (Jeremiah Venture): • Effluent Irrigation Proposed for Rocky Soils • Failure to Identify Karst Features • Water Balance Based on Western Evapotranspiration Values
Failure to Identify Recharge Features Images from Hauwert, Preliminary Phase I Assessment of the Jeremiah Ventures Site, September 25, 2009.
TLAP Recommendations • Eliminate TLAPs on the Edwards Aquifer Recharge Zone
TLAP Recommendations • Eliminate TLAPs on the Edwards Aquifer Recharge Zone • Establish Consistent Effluent Limits • Total Nitrogen: 3 milligrams per liter • Total Phosphorous: 0.1 milligram per liter
TLAP Recommendations • Standardize Effluent Irrigation Requirements
TLAP Recommendations • Standardize Effluent Irrigation Requirements • Standardize Effluent Storage Requirements
TLAP Recommendations • Standardize Effluent Irrigation Requirements • Standardize Effluent Storage Requirements • Eliminate Leaching Allowance
TLAP Recommendations • Standardize Effluent Irrigation Requirements • Standardize Effluent Storage Requirements • Eliminate Leaching Allowance • Require Soil, Spring, Stream, and Well Monitoring with Re-permitting Triggers
TLAP Recommendations • Standardize Effluent Irrigation Requirements • Standardize Effluent Storage Requirements • Eliminate Leaching Allowance • Require Soil, Spring, Stream, and Well Monitoring with Re-permitting Triggers • Require Soil Monitoring and Automatic Response to Saturated or Frozen Soil Conditions