Download
1 / 33
330 likes | 446 Views
Ultrasound Simulations using REC and SAFT. Presenter : Tony Podkowa November 13, 2012 Advisor: Dr José R. Sánchez Department of Electrical and Computer Engineering. Outline. I. Introduction II. Project Summary III. Block Diagram IV. Preliminary Work V. Schedule. Outline.

E N D
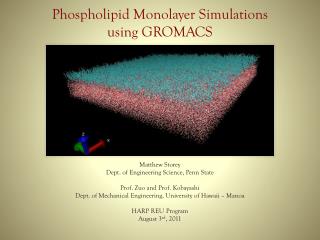
Ultrasound Simulations using REC and SAFT Presenter: Tony Podkowa November 13, 2012 Advisor: Dr José R. Sánchez Department of Electrical and Computer Engineering
Outline I. Introduction II. Project Summary III. Block Diagram IV. Preliminary Work V. Schedule
Outline I. Introduction II. Project Summary III. Block Diagram IV. Preliminary Work V. Schedule
Introduction Medical Applications Tumor detection Blood flow imaging Cardiac imaging Piezoelectric Transducer Ultrasonic Pulses Tissue Density reflects Pulses
Outline I. Introduction II. Project Summary III. Block Diagram IV. Preliminary Work V. Schedule
Project Summary Specialized techniques improve image resolution and SNR. Resolution Enhancement Compression (REC) Improves Axial Resolution and SNR Synthetic Aperture Focusing Techniques (SAFT) Improve Lateral Resolution and SNR Goal: To simulate the combination of bothREC and SAFT in an ultrasound system using the Matlabaddon Field II.
Outline I. Introduction II. Project Summary III. Block Diagram IV. Preliminary Work V. Schedule
System Block Diagram Received Echo Signals Beamformed Signals Vin(t) Vpc(t) REC Transducer SAFT Image Recon. Image Output Vlc(t)
Resolution Enhancement Compression Pulse Compression Technique Uses Convolution Equivalence Exchange the transducer impulse response a desired response Increases bandwidth Better resolution
Source: M. Oelze, “Bandwidth and Resolution Enhancement through Pulse Compression,” IEEE Trans. Ultrason., Ferroelec. and Freq. Control, vol. 54, pp. 768–781, Apr. 2007.
REC Subsystem Vulc(f) Vpc(f) Vupc(f) Vlc(f) Waveform Generator Tukey Window
System Block Diagram Received Echo Signals Beamformed Signals Vin(t) Vpc(t) REC Transducer SAFT Image Recon. Image Output Vlc(t)
Transducer Linear Array Transducer consisting of several elements Capable of emitting and receiving ultrasonic pulses Generates several signals to be processed to form an image. S. I. Nikolov, Synthetic Aperture Tissue and Flow Ultrasound Imaging. PhD thesis, Technical University of Denmark, Aug. 2001.
Transducer Specifications 256 Elements 3 MHz Center Frequency 200 MHz Sampling Frequency 4 mm Element Height 0.26 mm Element Width 0.04 mm Element Kerf 20 mm Focus Kerf Height Width
System Block Diagram Received Echo Signals Beamformed Signals Vin(t) Vpc(t) REC Transducer SAFT Image Recon. Image Output Vlc(t)
Synthetic Aperture Focusing Techniques Electrically focuses signals to create an artificial aperture. Uses different excitation schemes Three Variations: Generic Synthetic Aperture Ultrasound (GSAU) Synthetic Transmit Aperture Ultrasound (STAU) Synthetic Receive Aperture Ultrasound (SRAU) Results generated by delay and sum beamforming.
GSAU Transmit with one and receive with one. Each transmit event generates a low resolution image. Information needs to be delayed appropriately for each pixel before summing. Gain in SNR:
STAU Transmit with one and receive with all. Additional degree of freedom Gain in SNR:
SRAU Transmit with all and receive with one. Gain in SNR:
SAFT Received Echo Signals Apodization Delay and Sum Beamforming Image Scan Lines
Apodization Spatial Windowing Used to shape the beam profile Reweighting by apodization coefficients Several different windowing techniques can be studied Rectangular Triangular Raised Cosine a1 a2 aN
System Block Diagram Received Echo Signals Beamformed Signals Vin(t) Vpc(t) REC Transducer SAFT Image Recon. Image Output Vlc(t)
Image Reconstruction Subsystem Beamformed Signal Wiener Filter Envelope Detection Logarithmic Compression Limiter Image Scan Line Vlc(t)
Outline I. Introduction II. Project Summary III. Block Diagram IV. Preliminary Work V. Schedule
Preliminary Work Image Reconstruction subsystem completed. STAU partially completed Conventional pulsing instead of REC Individual low resolution images generated. Output image generated. Rectangular apodization 64 elements instead of 256
Outline I. Introduction II. Project Summary III. Block Diagram IV. Preliminary Work V. Schedule
Schedule 1/28 – 2/8:REC 2/11 – 2/22: GPGPU implementation of STAU 2/25 – 3/8: GSAU 3/11 – 3/29: SRAU 4/1 – 4/12: Prepare for Student Scholarship Expo 4/15 – 4/19: Expo 4/22 – 5/3: Write Final Report & Presentation
Ultrasound Simulations using REC and SAFT Presenter: Tony Podkowa November 13, 2012 Advisor: Dr José R. Sánchez Department of Electrical and Computer Engineering
Matched Filter Echo Signal Pre- amplifier ADC Matched filter A A SAFT Reconstructed image