Download
1 / 1
10 likes | 117 Views
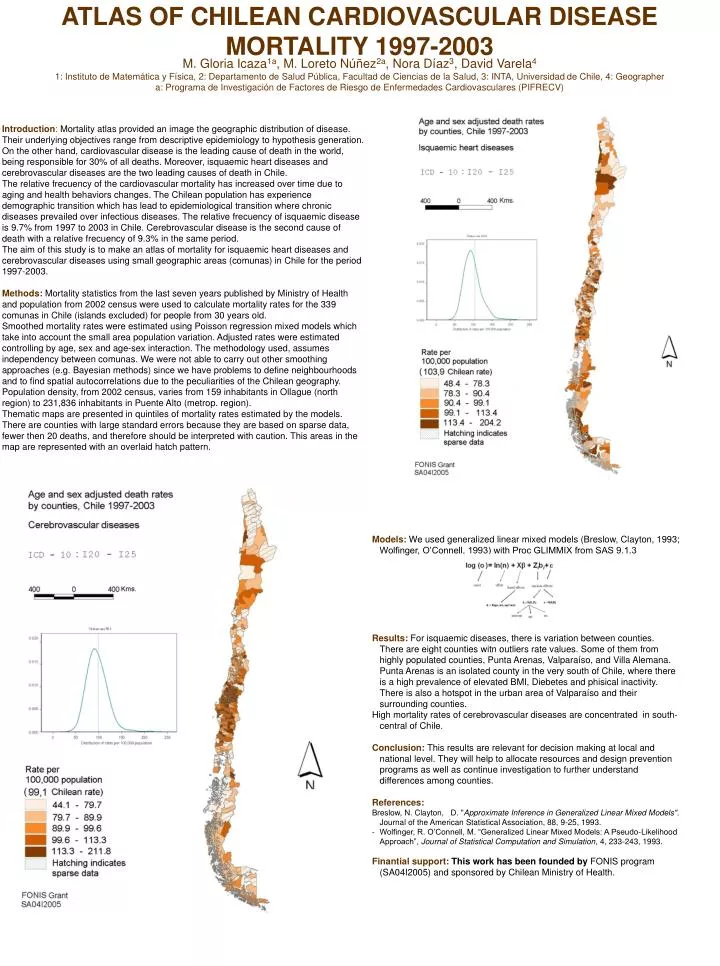
ATLAS OF CHILEAN CARDIOVASCULAR DISEASE MORTALITY 1997-2003. M. Gloria Icaza 1a , M. Loreto Núñez 2a , Nora Díaz 3 , David Varela 4 1: Instituto de Matemática y Física, 2: Departamento de Salud Pública, Facultad de Ciencias de la Salud, 3: INTA, Universidad de Chile, 4: Geographer

E N D
ATLAS OF CHILEAN CARDIOVASCULAR DISEASE MORTALITY 1997-2003 M. Gloria Icaza1a, M. Loreto Núñez2a, Nora Díaz3, David Varela4 1: Instituto de Matemática y Física, 2: Departamento de Salud Pública, Facultad de Ciencias de la Salud, 3: INTA, Universidad de Chile, 4: Geographer a: Programa de Investigación de Factores de Riesgo de Enfermedades Cardiovasculares (PIFRECV) Introduction:Mortality atlas provided an image the geographic distribution of disease. Their underlying objectives range from descriptive epidemiology to hypothesis generation.On the other hand, cardiovascular disease is the leading cause of death in the world, being responsible for 30% of all deaths. Moreover, isquaemic heart diseases and cerebrovascular diseases are the two leading causes of death in Chile. The relative frecuency of the cardiovascular mortality has increased over time due to aging and health behaviors changes. The Chilean population has experience demographic transition which has lead to epidemiological transition where chronic diseases prevailed over infectious diseases. The relative frecuency of isquaemic disease is 9.7% from 1997 to 2003 in Chile. Cerebrovascular disease is the second cause of death with a relative frecuency of 9.3% in the same period. The aim of this study is to make an atlas of mortality for isquaemic heart diseases and cerebrovascular diseases using small geographic areas (comunas) in Chile for the period 1997-2003. Methods: Mortality statistics from the last seven years published by Ministry of Health and population from 2002 census were used to calculate mortality rates for the 339 comunas in Chile (islands excluded) for people from 30 years old. Smoothed mortality rates were estimated using Poisson regression mixed models which take into account the small area population variation. Adjusted rates were estimated controlling by age, sex and age-sex interaction. The methodology used, assumes independency between comunas. We were not able to carry out other smoothing approaches (e.g. Bayesian methods) since we have problems to define neighbourhoods and to find spatial autocorrelations due to the peculiarities of the Chilean geography. Population density, from 2002 census, varies from 159 inhabitants in Ollague (north region) to 231,836 inhabitants in Puente Alto (metrop. region). Thematic maps are presented in quintiles of mortality rates estimated by the models. There are counties with large standard errors because they are based on sparse data, fewer then 20 deaths, and therefore should be interpreted with caution. This areas in the map are represented with an overlaid hatch pattern. • Models: We used generalized linear mixed models (Breslow, Clayton, 1993; Wolfinger, O’Connell, 1993) with Proc GLIMMIX from SAS 9.1.3 • Results:For isquaemic diseases, there is variation between counties. There are eight counties witn outliers rate values. Some of them from highly populated counties, Punta Arenas, Valparaíso, and Villa Alemana. Punta Arenas is an isolated county in the very south of Chile, where there is a high prevalence of elevated BMI, Diebetes and phisical inactivity. There is also a hotspot in the urban area of Valparaíso and their surrounding counties. • High mortality rates of cerebrovascular diseases are concentrated in south-central of Chile. • Conclusion:This results are relevant for decision making at local and national level. They will help to allocate resources and design prevention programs as well as continue investigation to further understand differences among counties. • References: • Breslow, N. Clayton, D. "Approximate Inference in Generalized Linear Mixed Models". Journal of the American Statistical Association, 88, 9-25, 1993. • Wolfinger, R. O’Connell, M. “Generalized Linear Mixed Models: A Pseudo-Likelihood Approach”, Journal of Statistical Computation and Simulation, 4, 233-243, 1993. • Finantial support: This work has been founded by FONIS program (SA04I2005) and sponsored by Chilean Ministry of Health.