Download

1 / 51
510 likes | 519 Views
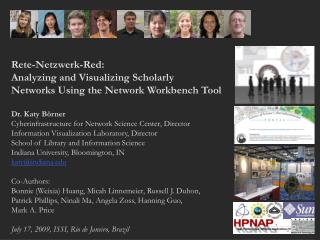
Rete-Netzwerk-Red: Analyzing and Visualizing Scholarly Networks Using the Network Workbench Tool Dr. Katy Börner Cyberinfrastructure for Network Science Center, Director Information Visualization Laboratory, Director School of Library and Information Science

E N D
Rete-Netzwerk-Red: Analyzing and Visualizing Scholarly Networks Using the Network Workbench Tool Dr. Katy Börner Cyberinfrastructure for Network Science Center, Director Information Visualization Laboratory, Director School of Library and Information Science Indiana University, Bloomington, IN katy@indiana.edu Co-Authors: Bonnie (Weixia) Huang, Micah Linnemeier, Russell J. Duhon, Patrick Phillips, Ninali Ma, Angela Zoss, Hanning Guo, Mark A. Price July 17, 2009, ISSI, Rio de Janeiro, Brazil
What cyberinfrastructure is required to measure, model, analyze, and communicate scholarly data and ultimately scientific progress? This talk presents our efforts to create a science of science cyberinfrastructure that supports: Data access and federation via the Scholarly Database, http://sdb.slis.indiana.edu, Data preprocessing, modeling, analysis, and visualization using plug-and-play cyberinfrastructures such as the Network Workbench, http://nwb.slis.indiana.edu, and Communication of science to a general audience via the Mapping Science exhibit at http://scimaps.org. This talk should be particularly interesting for those interested to Map their very own domain of research, Test and compare data federation, mining, visualization algorithms on large scale datasets, Use advanced network science algorithms in their own research. Overview
Needs Analysis Conceptualizations of Science Scholarly Database (SDB) Network Workbench (NWB) Tool Exemplary Analyses and Visualizations using SDB/NWB Mapping Science Exhibit Overview
A total of 34 science policy makers and researchers at university campus level (8), program officer level (12), and division director level at national, state, and private foundations (10) as well as science policy makers from Europe and Asia (4) were interviewed between Feb. 8th, 2008 and Oct. 2nd, 2008. Each interview comprised a 40 min, audio-taped, informal discussion on specific information needs, datasets and tools currently used, and information on what a 'dream tool' might look and feel like. There is also a pre-interview questionnaire to acquire demographics and a post-interview questionnaire to get input on priorities. Data compilation is in progress, should be completed in July 2009, and will be submitted as a journal paper. Some data excerpts are given here. 1. Needs Analysis
In the Post-Questionnaire Subjects were asked: “What are initial thoughts regarding the utility of science of science studies for improving decision making? How would access to datasets and tool speed up and increase the quality of your work?” Excerpts of answers: Two areas have great potential: Understanding S&T as a dynamic system, means to display, visualize and manipulate large interrelated amounts of data in maps that allow better intuitive understanding. Look for new areas of research to encourage growth/broader impacts of research--how to assess/ transformative science--what scientific results transformed the field or created a new field/ finding panelists/reviews/ how much to invested until a plateau in knowledge generation is reached/how to define programs in the division. Scientometrics as cartography of the evolution of scientific practice that no single actor (even Nobel Laureates) can have. Databases provide a macro-view of the whole of scientific field and its structure. This is needed to make rational decision at the level of countries/states/provinces/regions. Understanding where funded scientists are positioned in the global map of science. Self-knowledge about effects of funding/ self-knowledge about how to improve funding schemes. Ability to see connections between people and ideas, integrate research findings, metadata, clustering career measurement, workforce models, impact (economic/social) on society-interactions between levels of science; lab, institution, agency, Fed Budget, public interests. It would be valuable to have tools that would allow one automatically to generate co-citation, co-authorship maps…I am particularly interested in network dynamics.
It would enable more quantitative decision making in place of an "impression-based" system, and provide a way to track trends, which is not done now. When NSF started SciSIP, I was skeptical, but I am more disposed to the idea behind it now although I still don't have a clear idea what scientific metrics will be…..how they will apply across disciplines and whether it's really possible to predict with any accuracy the consequences of any particular decision of a grant award. SoS potentially useful to policymakers by providing qualitative and quantitative data on the impacts of science toward government policy goals…ideally these studies would enable policy makers to make better decisions for linking science to progress toward policy goals. Tracking faculty's work over time to determine what factors get in the way of productivity and which enhance, e.g. course-releases to allow more time--does this really work or do people who want to achieve do so in spite of barriers. I'm not sure that this has relevance to my decision-making. There is a huge need for more reliable data about my organization and similar ones, but that seems distinct from data and tools to study science. It would assist me enormously. Help to give precedents that would rationalize decisions--help to assess research outside one's major area. Ways of assessing innovation, ways of assessing interactions (among researchers, across areas, outside academia). It would allow me to answer questions from members of congress provide visual presentations of data for them. Very positive step--could fill important need in understanding innovation systems and organizations.
2. Conceptualizations of Science See Special Issue of Journal ofInformetrics, 3(3), Jan 2009. Editorial is available at http://ivl.slis.indiana.edu/km/pub/2009-borner-scharnhorst-joi-sos-intro.pdf
“From Data Silos to Wind Chimes” Create public databases that any scholar can use. Share the burden of data cleaning and federation. Interlink creators, data, software/tools, publications, patents, funding, etc. La Rowe, Gavin, Ambre, Sumeet, Burgoon, John, Ke, Weimao and Börner, Katy. (2007) The Scholarly Database and Its Utility for Scientometrics Research. In Proceedings of the 11th International Conference on Scientometrics and Informetrics, Madrid, Spain, June 25- 27, 2007, pp. 457-462. http://ella.slis.indiana.edu/~katy/paper/07-issi-sdb.pdf 3. Scholarly Databasehttp://sdb.slis.indiana.edu Nianli Ma
Datasets available via the Scholarly Database (* internally) Aim for comprehensive time, geospatial, and topic coverage. 3. Scholarly Database: # Records & Years Covered
3. Scholarly Database: Web InterfaceAnybody can register for free to search the about 23 million records and download results as data dumps. Currently the system has over 120 registered users from academia, industry, and government from over 60 institutions and four continents.
Since March 2009:Users can download networks:- Co-author- Co-investigator - Co-inventor- Patent citationand tables for burst analysis in NWB.
4. Scientometrics Filling of Network Workbench Tool will ultimately be ‘packaged’ as a SciPolicy’ tool. http://nwb.slis.indiana.edu/ The Network Workbench (NWB) tool supports researchers, educators, and practitioners interested in the study of biomedical, social and behavioral science, physics, and other networks. In Feb. 2009, the tool provides more 100 plugins that support the preprocessing, analysis, modeling, and visualization of networks. More than 40 of these plugins can be applied or were specifically designed for S&T studies. It has been downloaded more than 19,000 times since Dec. 2006. Herr II, Bruce W., Huang, Weixia (Bonnie), Penumarthy, Shashikant & Börner, Katy. (2007). Designing Highly Flexible and Usable Cyberinfrastructures for Convergence. In Bainbridge, William S. & Roco, Mihail C. (Eds.), Progress in Convergence - Technologies for Human Wellbeing (Vol. 1093, pp. 161-179), Annals of the New York Academy of Sciences, Boston, MA.
Project Details Investigators: Katy Börner, Albert-Laszlo Barabasi, Santiago Schnell, Alessandro Vespignani & Stanley Wasserman, Eric Wernert Software Team: Lead: Micah Linnemeier Members: Patrick Phillips, Russell Duhon, Tim Kelley & Ann McCranie Previous Developers: Weixia (Bonnie) Huang, Bruce Herr, Heng Zhang, Duygu Balcan, Mark Price, Ben Markines, Santo Fortunato, Felix Terkhorn, Ramya Sabbineni, Vivek S. Thakre & Cesar Hidalgo Goal: Develop a large-scale network analysis, modeling and visualization toolkit for physics, biomedical, and social science research. Amount: $1,120,926, NSF IIS-0513650 award Duration: Sept. 2005 - Aug. 2009 Website: http://nwb.slis.indiana.edu Network Workbench (http://nwb.slis.indiana.edu). 13
Personal Bibliographies Bibtex (.bib) Endnote Export Format (.enw) Data Providers Web of Science by Thomson Scientific/Reuters (.isi) Scopus by Elsevier (.scopus) Google Scholar (access via Publish or Perish save as CSV, Bibtex, EndNote) Awards Search by National Science Foundation (.nsf) Scholarly Database (all text files are saved as .csv) Medline publications by National Library of Medicine NIH funding awards by the National Institutes of Health (NIH) NSF funding awards by the National Science Foundation (NSF) U.S. patents by the United States Patent and Trademark Office (USPTO) Medline papers – NIH Funding 4. NWB Tool: Supported Data Formats Network Formats • NWB (.nwb) • Pajek (.net) • GraphML (.xml or .graphml) • XGMML (.xml) Burst Analysis Format • Burst (.burst) Other Formats • CSV (.csv) • Edgelist (.edge) • Pajek (.mat) • TreeML (.xml)
4. NWB Tool: Algorithms (July 1st, 2008)See https://nwb.slis.indiana.edu/community and handout for details.
NWB tool can be used for data conversion. Supported output formats comprise: CSV (.csv) NWB (.nwb) Pajek (.net) Pajek (.mat) GraphML (.xml or .graphml) XGMML (.xml) GUESS Supports export of images into common image file formats. Horizontal Bar Graphs saves out raster and ps files. 4. NWB Tool: Output Formats
Individual Level Loading ISI files of major network science researchers, extracting, analyzing and visualizing paper-citation networks and co-author networks. Loading NSF datasets with currently active NSF funding for 3 researchers at Indiana U Institution Level Indiana U, Cornell U, and Michigan U, extracting, and comparing Co-PI networks. Scientific Field Level Extracting co-author networks, patent-citation networks, and detecting bursts in SDB data. 5. Exemplary Analyses and Visualizations
Individual Level Loading ISI files of major network science researchers, extracting, analyzing and visualizing paper-citation networks and co-author networks. Loading NSF datasets with currently active NSF funding for 3 researchers at Indiana U Institution Level Indiana U, Cornell U, and Michigan U, extracting, and comparing Co-PI networks. Scientific Field Level Extracting co-author networks, patent-citation networks, and detecting bursts in SDB data. 5. Exemplary Analyses and Visualizations
Download all papers by Eugene Garfield Stanley Wasserman Alessandro Vespignani Albert-László Barabási from Science Citation Index Expanded (SCI-EXPANDED) --1955-present Social Sciences Citation Index (SSCI)--1956-present Arts & Humanities Citation Index (A&HCI)--1975-present Data Acquisition from Web of Science
Age Total # Cites Total # Papers H-Index Eugene Garfield 82 1,525 672 31 Stanley Wasserman 122 35 17 Alessandro Vespignani 42 451 101 33 Albert-László Barabási 40 2,218 126 47 (Dec 2007) 41 16,920 159 52 (Dec 2008) Comparison of CountsNo books and other non-WoS publications are covered.
Load*yournwbdirectory*/sampledata/scientometrics/isi/FourNetSciResearchers.isi’ using 'File > Load and Clean ISI File'. To extract the co-author network, select the ‘361 Unique ISI Records’ table and run 'Scientometrics > Extract Co-Author Network’ using isi file format: The result is an undirected network of co-authors in the Data Manager. It has 247 nodes and 891 edges. To view the complete network, select the network and run ‘Visualization > GUESS > GEM’. Run Script>Run Script… . And select Script folder > GUESS > co-author-nw.py. Extract Co-Author Network
Eugene Garfield Stanley Wasserman Alessandro Vespignani Albert-László Barabási Comparison of Co-Author Networks
Load ‘*yournwbdirectory*/sampledata/scientometrics/isi/FourNetSciResearchers.isi’ using 'File > Load and Clean ISI File'. To extract the paper-citation network, select the ‘361 Unique ISI Records’ table and run 'Scientometrics > Extract Directed Network' using the parameters: The result is a directed network of paper citations in the Data Manager. It has 5,335 nodes and 9,595 edges. To view the complete network, select the network and run ‘Visualization > GUESS’. Run ‘Script>Run Script …’ and select ‘yournwbdirectory*/script/GUESS/paper-citation-nw.py’. Paper-Citation Network Layout
Individual Level Loading ISI files of major network science researchers, extracting, analyzing and visualizing paper-citation networks and co-author networks. Loading NSF datasets with currently active NSF funding for 3 researchers at Indiana U Institution Level Indiana U, Cornell U, and Michigan U, extracting, and comparing Co-PI networks. Scientific Field Level Extracting co-author networks, patent-citation networks, and detecting bursts in SDB data. 5. Exemplary Analyses and Visualizations
NSF Awards Search via http://www.nsf.gov/awardsearch Save in CSV format as *name*.nsf
Name # Awards First A. Starts Total Amount to Date Geoffrey Fox 27 Aug 1978 12,196,260 Michael McRobbie 8 July 1997 19,611,178 Beth Plale 10 Aug 2005 7,224,522 Disclaimer: Only NSF funding, no funding in which they were senior personnel, only as good as NSF’s internal record keeping and unique person ID. If there are ‘collaborative’ awards then only their portion of the project (award) will be included. NSF Awards Search Results
Load into NWB, open file to count records, compute total award amount. Run ‘Scientometrics > Extract Co-Occurrence Network’ using parameters: Select “Extracted Network ..” and run ‘Analysis > Network Analysis Toolkit (NAT)’ Remove unconnected nodes via ‘Preprocessing > Delete Isolates’. ‘Visualization > GUESS’ , layout with GEM Run ‘co-PI-nw.py’ GUESS script to color/size code. Using NWB to Extract Co-PI Networks
Geoffrey Fox Michael McRobbie Beth Plale
Geoffrey Fox Last Expiration date July 10 Michael McRobbie Feb 10 Beth Plale Sept 09
Individual Level Loading ISI files of major network science researchers, extracting, analyzing and visualizing paper-citation networks and co-author networks. Loading NSF datasets with currently active NSF funding for 3 researchers at Indiana U Institution Level Indiana U, Cornell U, and Michigan U, extracting, and comparing Co-PI networks. Scientific Field Level Extracting co-author networks, patent-citation networks, and detecting bursts in SDB data. 5. Exemplary Analyses and Visualizations
NSF Awards Search via http://www.nsf.gov/awardsearch Save in CSV format as *institution*.nsf
Active NSF Awards on 11/07/2008: Indiana University 257 (there is also Indiana University at South Bend Indiana University Foundation, Indiana University Northwest, Indiana University-Purdue University at Fort Wayne, Indiana University-Purdue University at Indianapolis, Indiana University-Purdue University School of Medicine) Cornell University 501 (there is also Cornell University – State, Joan and Sanford I. Weill Medical College of Cornell University) University of Michigan Ann Arbor 619 (there is also University of Michigan Central Office, University of Michigan Dearborn, University of Michigan Flint, University of Michigan Medical School) Save files as csv but rename into .nsf. Or simply use the files saved in ‘*yournwbdirectory*/sampledata/scientometrics/nsf/’.
Extracting Co-PI Networks Load NSF data, selecting the loaded dataset in the Data Manager window, run ‘Scientometrics > Extract Co-Occurrence Network’ using parameters: Two derived files will appear in the Data Manager window: the co-PI network and a merge table. In the network, nodes represent investigators and edges denote their co-PI relationships. The merge table can be used to further clean PI names. Running the ‘Analysis > Network Analysis Toolkit (NAT)’ reveals that the number of nodes and edges but also of isolate nodes that can be removed running ‘Preprocessing > Delete Isolates’. Select ‘Visualization > GUESS’ to visualize. Run ‘co-PI-nw.py’ script.
Indiana U: 223 nodes, 312 edges, 52 components U of Michigan: 497 nodes, 672 edges, 117 c Cornell U: 375 nodes, 573 edges, 78 c
Extract Giant Component Select network after removing isolates and run ‘Analysis > Unweighted and Undirected > Weak Component Clustering’ with parameter Indiana’s largest component has 19 nodes, Cornell’s has 67 nodes, Michigan’s has 55 nodes. Visualize Cornell network in GUESS using same .py script and save via ‘File > Export Image’ as jpg.
Largest component of Cornell U co-PI network Node size/color ~ totalawardmoney Top-50 totalawardmoney nodes are labeled.
Top-10 Investigators by Total Award Money for i in range(0, 10): print str(nodesbytotalawardmoney[i].label) + ": " + str(nodesbytotalawardmoney[i].totalawardmoney) Indiana University Curtis Lively: 7,436,828 Frank Lester: 6,402,330 Maynard Thompson: 6,402,330 Michael Lynch: 6,361,796 Craig Stewart: 6,216,352 William Snow: 5,434,796 Douglas V. Houweling: 5,068,122 James Williams: 5,068,122 Miriam Zolan: 5,000,627 Carla Caceres: 5,000,627 Cornell University Maury Tigner: 107,216,976 Sandip Tiwari: 72,094,578 Sol Gruner: 48,469,991 Donald Bilderback: 47,360,053 Ernest Fontes: 29,380,053 Hasan Padamsee: 18,292,000 Melissa Hines: 13,099,545 Daniel Huttenlocher: 7,614,326 Timothy Fahey: 7,223,112 Jon Kleinberg: 7,165,507 Michigan University Khalil Najafi: 32,541,158 Kensall Wise: 32,164,404 Jacquelynne Eccles: 25,890,711 Georg Raithel: 23,832,421 Roseanne Sension: 23,812,921 Theodore Norris: 23,35,0921 Paul Berman: 23,350,921 Roberto Merlin: 23,350,921 Robert Schoeni: 21,991,140 Wei-Jun Jean Yeung:21,991,140
Individual Level Loading ISI files of major network science researchers, extracting, analyzing and visualizing paper-citation networks and co-author networks. Loading NSF datasets with currently active NSF funding for 3 researchers at Indiana U Institution Level Indiana U, Cornell U, and Michigan U, extracting, and comparing Co-PI networks. Scientific Field Level Extracting co-author networks, patent-citation networks, and detecting bursts in SDB data. 5. Exemplary Analyses and Visualizations
The Power of Maps (2005) Science Maps for Economic Decision Makers (2008)The Power of Reference Systems (2006) Science Maps for Science Policy Makers (2009) Science Maps for Scholars (2010) Science Maps as Visual Interfaces to Digital Libraries (2011) Science Maps for Kids (2012) Science Forecasts (2013)The Power of Forecasts (2007) How to Lie with Science Maps (2014) Exhibit has been shown in 52 venues on four continents. Also at- NSF, 10th Floor, 4201 Wilson Boulevard, Arlington, VA.- Chinese Academy of Sciences, China, May 17-Nov. 15, 2008.- University of Alberta, Edmonton, Canada, Nov 10-Jan 31, 2009 - Center of Advanced European Studies and Research, Bonn, Germany, Dec. 11-19, 2008. Mapping Science Exhibit – 10 Iterations in 10 yearshttp://scimaps.org/ 47
Debut of 5th Iteration of Mapping Science Exhibit at MEDIA X on May 18, 2009 at Wallenberg Hall, Stanford University http://mediax.stanford.edu http://scaleindependentthought.typepad.com/photos/scimaps 48
Science Maps in “Expedition Zukunft” science train visiting 62 cities in 7 months 12 coaches, 300 m long Opened on April 23rd, 2009 by German Chancellor Merkel http://www.expedition-zukunft.de 49
This is the only mockup in this slide show. Everything else is available today. Katy Borner: Computational Scientometrics That Informs Science Policy 50