Download
1 / 5
50 likes | 144 Views
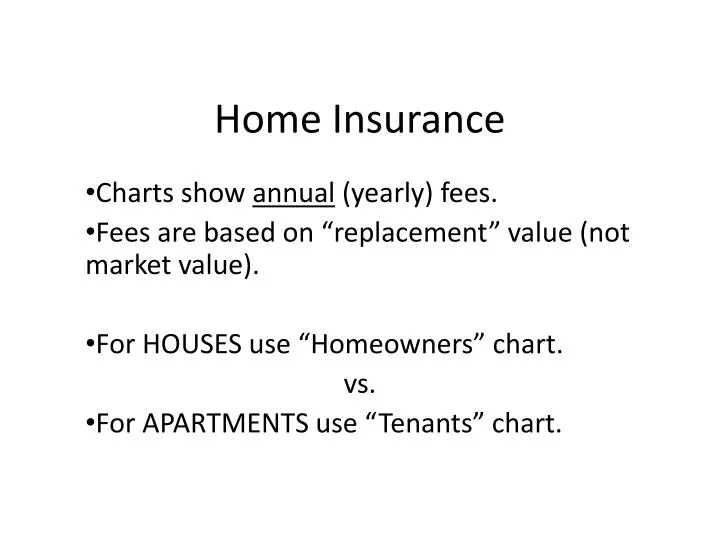
Home Insurance. Charts show annual (yearly) fees. Fees are based on “replacement” value (not market value). For HOUSES use “Homeowners” chart. vs. For APARTMENTS use “Tenants” chart.

E N D
Home Insurance Charts show annual (yearly) fees. Fees are based on “replacement” value (not market value). For HOUSES use “Homeowners” chart. vs. For APARTMENTS use “Tenants” chart.
The farther you live from fire hydrants and fire halls, the more your insurance will cost due to the higher risk of damage. • Standard insurance is cheaper. Comprehensive costs more but is better insurance – more things are covered.
“Deductibles” • The amount you pay IF something gets damaged or stolen. The rest of the repair or replacement is FREE. • $500 deductible is the usual amount. This plan is included in your insurance. • If you want to be able to pay less later if something does happen, your insurance costs more. Ex: $200 deductible costs 10% extra. • This concept is the same for car insurance. • You pay your annual fee for insurance each year but you only pay the deductible if an incident occurs. Hopefully never!
How to use the charts: • Sometimes the number in the chart is your final answer. • 2 reasons to do any further calculations: 1) If your house is off the chart, more than $200,000, Start with the bottom number in the column then ADD (the additional cost) x (extra $000’s) 2) If you want a lower deductible ($200) Start with the chart number then ADD 10% to chart number (Important! Notice do not use $200 or $500 in the calculation!)
Answers: #4) $379 (Chart # is the final answer.) #5) $1033.50 #6) $295.90 #7) $44 extra for comprehensive vs. standard #8) $24.30 extra for a cheaper deductible