Download
1 / 35
350 likes | 355 Views
Status of lake trout in Lake Superior 1993-2000. Shawn Sitar, MIDNR; Chuck Bronte, USFWS; Mark Ebener, CORA; Tom Fratt, RCFD; Ken Gebhardt, BMIC; Ted Halpern, MNDNR; Bill Mattes, GLIFWC; Gene Mensch, KBIC; Mike Petzold, OMNR; Steve Schram, WIDNR; Don Schreiner, MNDNR.

E N D
Status of lake trout in Lake Superior1993-2000 Shawn Sitar, MIDNR; Chuck Bronte, USFWS; Mark Ebener, CORA; Tom Fratt, RCFD; Ken Gebhardt, BMIC; Ted Halpern, MNDNR; Bill Mattes, GLIFWC; Gene Mensch, KBIC; Mike Petzold, OMNR; Steve Schram, WIDNR; Don Schreiner, MNDNR.
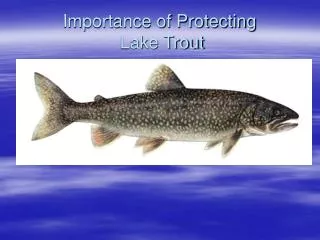
Fish Community Objectivelake trout Achieve and maintain genetically diverse self-sustaining populations of lake trout that are similar to those found in the lake prior to 1940, with lean lake trout being the dominant form in near-shore waters, siscowet lake trout the dominant form in offshore waters, and humper lake trout a common form in eastern waters and around Isle Royale.
10 11 7 18 12 19 1 20 17 13 9 3 2 14 6 4 15 23 21 16 5 24 28 22 MI1 26 25 29 MN3 MI3 27 31 30 MN2 MI4 MI2 32 WI2 33 MI6 MN1 MI7 MI5 MI8 WI1 34 Lake trout management units in Lake Superior
Lake trout stocking in Lake Superior 4 3 Millions stocked 2 1 0 1950 1960 1970 1980 1990 2000 Year
Relative abundance of lake trout in Lake Superior, 1993-2000 100 90 80 153.1 Wild 70 60 50 40 30 20 10 GM CPUE (fish/km/night) 0 100 Hatchery 90 80 70 60 50 40 30 20 10 0 WI-1 WI-2 MI-2 MI-3 MI-4 MI-5 MI-6 MI-7 MI-8 ON-1 ON-5 ON-9 MN-1 MN-2 MN-3 ON-33 ON-11 ON-24 ON-26 ON-28 ON-31 ON-34 Management Unit
Relative abundance of wild lake trout in Lake Superior, 1993-2000 100 90 80 70 60 50 40 30 20 10 0 WI-1 WI-2 MI-2 MI-3 MI-4 MI-5 MI-6 MI-7 MI-8 ON-1 ON-5 ON-9 MN-1 MN-2 MN-3 ON-11 ON-24 ON-26 ON-31 ON-33 ON-34 ON-28 Management Unit 153.1 GM CPUE (fish/km/night)
Relative abundance of hatchery lake trout in Lake Superior, 1993-2000 40 35 30 25 20 15 10 5 0 WI-1 WI-2 MI-2 MI-3 MI-4 MI-5 MI-6 MI-7 MI-8 ON-1 ON-5 ON-9 MN-2 MN-1 MN-3 ON-11 ON-24 ON-26 ON-28 ON-31 ON-33 ON-34 GM CPUE (fish/km/night) Management Unit
0.7 0.6 0.5 0.4 Total Annual Mortality 0.3 0.2 0.1 0 WI-1 WI-2 MI-2 MI-3 MI-4 MI-5 MI-6 MI-7 ON-1 MN-1 MN-2 MN-3 ON-14 ON-24 ON-28 ON-31 ON-33 Management Unit Total annual mortality for lake trout in Lake Superior 1993-2000 (catch curves)
Lean lake trout commercial yield in Lake Superior, 1867-2000 4 Canada 3.5 U.S. 3 2.5 2 Yield (million kg) 1.5 1 0.5 0 1867 1877 1887 1897 1907 1917 1927 1937 1947 1957 1967 1977 1987 1997 Year
2,000 Canada 1,800 Minnesota Wisconsin 1,600 Michigan 1,400 1,200 1,000 Yield (x 1,000 kg) 800 600 400 200 0 1993 1994 1995 1996 1997 1998 1999 2000 1929-43 Year Recent commercial harvest of lake trout in Lake Superior Avg. 1983-92
Recreational harvest of lake trout in Lake Superior, 1970-1999 80,000 Michigan 70,000 Wisconsin Minnesota 60,000 50,000 Number of fish 40,000 30,000 20,000 10,000 0 1970 1972 1974 1976 1978 1980 1982 1984 1986 1988 1990 1992 1994 1996 1998 Year
10 8 6 Average 1986-99 Marks per 100 Fish 4 2 0 1986 1988 1990 1992 1994 1996 1998 2000 Sea Lamprey Marking of Lean Lake Trout Lake Superior, 1986-2000
Lamprey Marking of Lake Trout Lake Superior, 1986-2000 Canada U. S. 12 10 8 6 Marks per 100 Lake Trout 4 2 0 1986 1988 1990 1992 1994 1996 1998 2000 Year
15 10 Marks per 100 Lake Trout West 5 East 0 1986 1988 1990 1992 1994 1996 1998 2000 Year Sea Lamprey Marking East & West U. S. Waters Lake Superior 1986-2000
Lake trout yield to sea lampreys and humans in Lake Superior during 1993-2000 1,200 Humans 1,100 Sea lampreys 1,000 900 800 Biomass (x 1000 kg) 700 600 500 400 300 200 100 0 1993 1994 1995 1996 1997 1998 1999 2000 1983-92 (avg.) Year
Mean length of age 7 lake trout in US waters of Lake Superior, 1970-92 70 Michigan (MI-3 - MI-7) 65 60 Planted 55 Wild 50 45 70 Wisconsin (WI-2) TOTAL LENGTH (cm) 65 Wild 60 55 Planted 50 45 70 Minnesota (MN-1 - MN-3) 65 Planted 60 55 50 45 1970 1972 1974 1976 1978 1980 1982 1984 1986 1988 1990 1992 YEAR From Hansen et al. (1994)
Mean length at age 7 for lake trout in Lake Superior, 1993-2000 620 HATCHERY WILD 600 580 560 TOTAL LENGTH (mm) 540 520 500 480 MINNESOTA MICHIGAN ONTARIO -W WISCONSIN ONTARIO-E
500 Canadian Offshore (> 80 m) commercial fishery 400 300 200 300 100 U.S. commercial fisheries 250 0 1950 1960 1970 1980 1990 2000 200 150 100 50 0 1950 1960 1970 1980 1990 Relative abundance of siscowets in commercial fisheries CPUE (Kg/km net)
Relative abundance of siscowets in Lake Superior (Agency surveys) 45.0 40.0 35.0 30.0 25.0 >599 20.0 480-599 15.0 360-479 10.0 5.0 240-359 0.0 120-239 Jun-96 Aug-97 0-119 Jun-00 CPUE (fish/305 m) 45.0 40.0 35.0 30.0 25.0 >599 20.0 480-599 15.0 360-479 10.0 5.0 240-359 0.0 Depth Bin (ft) 120-239 Jun-96 Aug-97 0-119 Date Jun-00 Siscowet Date Lean
25 18:1 Lean Mean = 14:1 Siscowet 20 13:1 15 12:1 Fish /305 m 10 16:1 2:1 5 0 MN-1 MI-2 MI-4 MI-5 MI-7 Management Unit Ratio of siscowets to leans by management unit
Age compositions of siscowet by management unit in 1996 MI-4 MI-7 MI-2 30 25 20 Number of fish 15 10 5 0 1 3 5 7 9 11 13 15 17 19 21 23 25 27 29 31 33 35 Age (yr)
Recent analyses of lake trout dynamics in Michigan waters of Lake Superior • Statistical catch-at-age models for wild lake trout in MI-5, MI-6, and MI-7 (MSC, TFC) • Stock-Recruitment analyses for lake trout in MI-3 through MI-7 (Jessica Richards) • Comparison of historic and modern abundance in Michigan waters (Mike Wilberg)
Statistical catch-at-age models • GLFC workshops. • Models integrate age-specific data from diverse sources. • Models used in 1836 Treaty waters to estimate quotas.
1,600 MI-5 1,400 MI-6 MI-7 1,200 1,000 800 600 400 200 0 1975 1977 1979 1981 1983 1985 1987 1989 1991 1993 1995 1997 1999 Year Wild lake trout abundance (ages 3+) Number of fish x 1,000
0.8 Target maximum MI-5 MI-6 0.7 MI-7 0.6 0.5 0.4 Total Mortality Rate 0.3 0.2 0.1 0 1975 1977 1979 1981 1983 1985 1987 1989 1991 1993 1995 1997 1999 Year Total annual mortality rates for ages 6-11 lake trout
Mortality rates for ages 6-11 wild lake trout in MI-5 0.2 Sea Lamprey Commercial Fishing 0.15 Recreational Fishing Natural Instantaneous mortality (year-1) 0.1 0.05 Year 0 1975 1977 1979 1981 1983 1985 1987 1989 1991 1993 1995 1997 1999
0.5 Sea lamprey 0.45 Commercial Fishing Recreational Fishing 0.4 Natural 0.35 0.3 Instantaneous mortality (year-1) 0.25 0.2 0.15 0.1 0.05 0 1978 1980 1982 1984 1986 1988 1990 1992 1994 1996 1998 2000 Year Mortality rates for ages 6-11 wild lake trout in MI-6
Mortality rates for ages 6-11 wild lake trout in MI-7 0.5 Sea Lamprey 0.45 Commercial Fishing Recreational Fishing 0.4 Natural 0.35 0.3 Instantaneous mortality (year-1) 0.25 0.2 0.15 0.1 0.05 0 1975 1977 1979 1981 1983 1985 1987 1989 1991 1993 1995 1997 1999 Year
Spawning stock biomass to project safe harvest levels • SSBR=the theoretical amount of mature female biomass produced per given recruit through its life. • SSBR Target =The total amount of spawning stock biomass produced per recruit that suffers the target maximum mortality • The SSBR values will vary over time as the mortality and maturity schedules vary over time.
Spawning stock biomass 0.6 Avg. 1998-2000 Target 0.5 0.4 SSBR (kg) 0.3 0.2 0.1 0.0 MI-5 MI-6 MI-7 Management Unit
30 30 30 30 30 MI-5 25 25 25 25 25 20 20 20 20 20 MI-4 15 15 15 15 15 MI-6 Recruitment CPE 10 10 10 10 10 MI-7 5 MI-3 0 50 100 150 200 Parental Stock CPE Lake trout stock-recruitment relationships in Michigan (Based on 1970-98 data) From: Doemel (2000)
MI-2 MI-3 MI-4 MI-5 MI-6 MI-7 MI-8 40.5 8.1 14.8 39.7 20.8 11.1 1.3 CPUE 1984-98 7.2 7.4 6.8 9.0 8.1 16.1 19.6 Historic CPUE (1929-43) Historic and Modern lake trout relative abundance From: Wilberg (2000)
Status of lake trout in Lake Superior 2000 • Wild lake trout abundance increasing MN & WI and high levels MI waters • Current abundance MI higher than historic values • recruitment peaked recently • indications of density dependence most areas. • Growth rates continue to decline and began in 1970s. • Siscowet abundance high & may be increasing • Sea lampreys kill more lake trout than fisheries.
Recommendations • Further develop & evaluate statistical population models • Quantify movement patterns. • Evaluate FCOs and reference points. • Monitor and assess siscowet populations. • Expand understanding of lake trout forms. • Develop bioenergetics models to assess food web stability. • Map and quantify lake trout habitat.