Download
1 / 20
200 likes | 315 Views
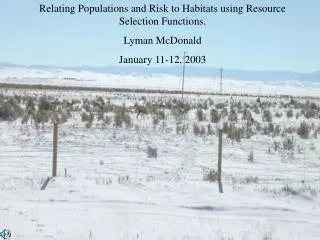
Resource Selection Functions and Patch Occupancy Models: Similarities and Differences. Lyman L. McDonald Senior Biometrician Western EcoSystems Technology, Inc. 217 South First Street, Suite 5 Laramie, Wyoming 82070 lmcdonald@west-inc.com http://www.west-inc.com.

E N D
Resource Selection Functions and Patch Occupancy Models: Similarities and Differences Lyman L. McDonald Senior Biometrician Western EcoSystems Technology, Inc. 217 South First Street, Suite 5 Laramie, Wyoming 82070 lmcdonald@west-inc.com http://www.west-inc.com
Resource selection functions and patch occupancy models • Powerful methods of identifying areas within a landscape that are occupied by a population of plants. • It is generally assumed that if individuals occupy (i.e., select or use) habitat units or ‘patches’ with certain characteristics, it improves their fitness, reproduction, or survival. • Justify management actions on natural resources. • Monitor distributions of populations (estimate proportion of units occupied). • Estimate relative probability that a unit is occupied.
Problem • A random sample of units in a study area are treated to limit invasion by a plant species. The other units are not treated. • After a period of time, these units are visited multiple times and presence or absence of the species is recorded. The species may be present, but missed. • History of visits at the points might be: • 1st Point 100010 • 2nd Point 000000 • 3rd Point 001011 • Etc. • Is it OK to estimate a Patch Occupancy Model and separate probability of occupancy from probability of detection given occupancy?
References • Manly, B.F.J., L.L. McDonald, D.L. Thomas, T.L. McDonald, and W.P. Erickson. 1996, 2002. Resource selection by animals: Statistical design and analysis for field studies, Second Edition. Kluwer Academic Publishers, Dordrecht. • Journal of Wildlife Management, No. 2, 2006. Papers by • Dana Thomas and Eric Taylor • Rich Alldredge and James Griswold • Chris Johnson, Scott Nielsen, Eve Merrill, Trent McDonald, and Mark Boyce. • Steve Buskirk and Josh Millspaugh • Darryl MacKenzie • Trent McDonald, Bryan Manly, Ryan Nielson, and Lowell Diller • Josh Millspaugh and seven co-authors • Hall Sawyer, Ryan Nielson, Fred Lindzey, and Lyman McDonald • MacKenzie, D.I., J.D. Nichols, J.A. Royle, K.H. Pollock, L.L. Bailey, and J.E. Hines. 2006. Occupancy Estimation and Modeling: Inferring Patterns and Dynamics of Species Occurrence. Academic Press, Burlington, MA.
Resource Selection Functions. Estimated relative probability of ‘use and detection of use’ by plants in first year of study. Five years later. [The repeated sampling suggested by MacKenzie et al. (2006) would allow us to model and plot Probability of “use.”]
Resource Selection Functions • Models for the relative probability (or probability) that a unit in the study area is used and detected to be used by the sampling protocol. • Pr(used and detected to be used) = Pr(used)*Pr(detected to be used | used). • Patch Occupancy Models. Attempt to estimate both terms in the equation, specifically the probability that a unit is used. • Pr(used)
Hypothetical Example: The selection function, , will change one normal distribution into another. Predictor variable, e.g., salinity =
Potential Predictor Variables (Covariates) • Elevation, Aspect, Slope, etc. • Precipitation • Soil chemistry (salinity, ….) • Soil physics • Competition (distance to nearest neighbors, community measures, …) • Grazing intensity by domestic livestock. • Grazing intensity by exotic wildlife. • Etc., Etc.
Weighted distribution theory: • x is a vector of covariates measured on ‘units.’ • fa(x) is the distribution of x for units in the study area (available units). • fu(x) is the distribution of x for used units. • w(x) is a non-negative weight or selection function. • If the constant, , can be evaluated then we obtain a probability selection function w*(x), where
Relationship to Information Theory: • Entropy = -loge(w(x)) • Kullback-Liebler directed distance • from fu(x) to fa(x) is • Efa[entropy] =Efa[-loge(w(x))] • = Efa[-log(selection function)].
Given estimates of two of the three functions, we can estimate the third. • w(x) is the fitness function in study of natural selection. • Horvitz-Thompson estimates. • Given data on units selected with unequally probabilities [with distribution fu(x)] • w(x) are the unequal sampling probabilities • we can obtain unbiased estimates of parameters of the population, fa(x) [e.g, Horvitz-Thompson estimators]. • Line transect sampling: x is the perpendicular distance to detected objects. • w(x) (i.e., g(x)) is the detection function, fa(x) is a uniform distribution given random placement of transects, and fu(x) is the distribution of observed perpendicular distances.
The most common application in resource selection studies. • Sample of units (patches, points) ‘available’ to plants in a study area. Estimate . • Sample of units (patches, points) ‘used and detected to be used’ by the plants. Estimate . • Estimate w(x), the Resource Selection Function (RSF), an estimate of relative probability of selection as a function of x. • Usually, sampling fractions are not known and w(x) cannot be scaled to a probability selection function. • Pr(use) Pr(detected|use) cannot be unscrambled without additional information.
Patch Occupancy Models (MacKenzie et al. 2006) • The original study design. • One sample of patches (units, points, etc.) from a study area ‘available’ to the plant species. • Repeated independent visits to the units over time. • Record ‘detection’ (1) or ‘non detection’ (0). • Data are a matrix of 1’s and 0’s (rows correspond to units, columns correspond to times) • Assumptions • Independent visits. • Closure (i.e., if a unit is occupied, then it is occupied on all survey times & if unoccupied, it is unoccupied on all survey times).
Patch Occupancy Models (MacKenzie et al. 2006) • For example, likelihoods for units with data 0101 0000 1000 • w*(xi)(1-p)p(1-p)p • w*(xi)(1-p)4 + (1-w*(xi)) • w*(xi)p(1-p)3 • p = Pr(detection | used), but could be modeled. • w*(xi) might be modeled by a logistic function of xi. • Combined likelihood function can be maximized for estimates of p and w*(xi). • Theory and estimation methods are similar to those for analysis of capture-recapture studies.
Alternatives for Repeated Independent Surveys • Conduct multiple ‘independent’ surveys during single visit to sample of sites. • Independent surveyors. • Within large sites, conduct surveys at multiple smaller subplots. • Closure assumption is easily violated! • If there is one plant in the large site, then at most one subplot can be occupied.
Random sample of 3 units, with 4 random sub-units within each. Record detection/non-detection of a species on single visit to each sub-unit. Study area with 10 units. Data matrix. 1 0 0 1 0 0 0 0 0 1 0 0 Assumption of Independence is easily violated.
Definition of ‘Available’ Units. • The study area defines the units under study. • Resource Selection Functions and Patch Occupancy Models provide models unique to the study area! • If the study area is changed, the estimated resource selection function and patch occupancy model will change. • Both methods depend equally on the units defined to be ‘available’ in the study area!
Problem • A random sample of units in a study area are treated to limit invasion by a plant species. The other units are not treated. • After a period of time, these units are visited multiple times and presence or absence of the species is recorded. The species may be present, but missed. • History of visits at the points might be: • 1st Point 100010 • 2nd Point 000000 • 3rd Point 001011 • Etc. • Is it OK to estimate a Patch Occupancy Model and separate probability of occupancy from probability of detection given occupancy?