Download
1 / 31
310 likes | 413 Views
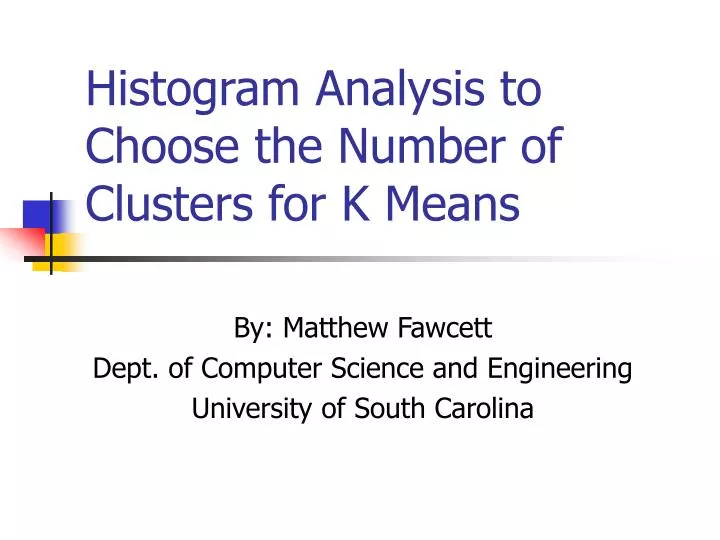
Histogram Analysis to Choose the Number of Clusters for K Means. By: Matthew Fawcett Dept. of Computer Science and Engineering University of South Carolina. Overview. Importance and use K means cluster algorithm The changes and adaptation I used Results Conclusions and Future Work.

E N D
Histogram Analysis to Choose the Number of Clusters for K Means By: Matthew Fawcett Dept. of Computer Science and Engineering University of South Carolina
Overview • Importance and use • K means cluster algorithm • The changes and adaptation I used • Results • Conclusions and Future Work
Importance • The main reason for use in Medical Imaging is for Segmentation. • Other uses outside of the realms of Image Processing(e.g. information retrieval) • Widespread algorithm
K Means Clustering • Problem is that user doesn’t know the optimal number of clusters to pick. • This is the problem I am trying to solve by using Histogram Analysis. • Histogram of the pixel intensity to find the optimal number of clusters for a picture.
Overview • Importance and use • K means cluster algorithm • The changes and adaptation I used • Results • Conclusions and Future Work
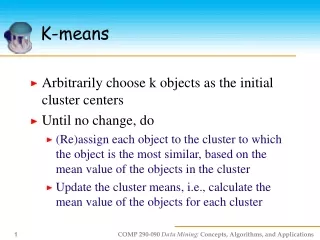
Algorithm • K means clusters is a very simple algorithm • First the user picks the number of centers that he/she would like. • Next the centers are chosen randomly.
Algorithm • I have read on different ways to choose the centers. (e.g. pick the 2 farthest points away from each other.) • After the centers have been established then we check every other point with each of the centers and find the minimum distance.
Algorithm • Each point is assigned to 1 cluster which it is closet. • This makes sense that points that are closer to each other are normally together • After each point is assigned the cluster centers are then recalculated based on these assignments
Algorithm • So once the new centers have been processed the routine starts over and continues until it converges and the centers do not move. • http://www.elet.polimi.it/upload/matteucc/Clustering/tutorial_html/AppletKM.html
Overview • Importance and use • K means cluster algorithm • The changes and adaptation I used • Results • Conclusions and Future Work
The new algorithm • Instead of guessing the number of clusters to have, I have used some preprocessing information to choose the number of clusters. • The first thing to be done is to make a histogram of pixel intensity.
Histogram • The histogram will probably have many peaks and valleys so the idea is to pick the correct number. • My idea was to basically count the peaks on the histogram. • However this can cause problems • Any guesses?
Histogram Which peaks do I take?
Histogram • I added a term called Threshold. • The threshold term just determines the cutoff point for a peak. • For example: If the threshold is 150 then I only take peaks with 151 or more. • The threshold I chose was the max color which was 255 divided by the number of pixels which equaled to 64. • How about any other problems with a histogram?
Histogram What about neighboring peaks?
Histogram • I know introduce another term to my work called span. • Span basically covers the number of pixels to the left and right of the current pixel. • For example if span was set to 3 then I would check 3 pixels to the left and 3 pixels to the right and then take the maxmium one over the threshold
Histogram • The span guarantees that I don’t have 2 pixels next to each other as 2 different centers in the picture. • This seems like a reasonable idea because pixels with the same intensity or near same intensity should share the same center and are probably close together.
Find Centers • Based on this information I determine the number of peaks above the threshold and no neighbors based on the span. • This the magic number I am using for the clusters by anglicizing the histogram of the pixel intensity.
Metric • Now I have the number of centers(k) • Start the k means algorithm • Pick k center points at random. • The metric I am using is the difference in intensity. We take the absolute value of this to make sure it positive. • Assign each pixel to one of the clusters
Resign the cluster centers • Now that we have all the pixels in a cluster we recalculate the centers. • Add up each pixel in each cluster and divide by the number of pixels in the cluster and we get the new center. • Supposed to repeat this until it converges but here I just do this 25 times.
Overview • Importance and use • K means cluster algorithm • The changes and adaptation I used • Results • Conclusions and Future Work
Results • Found some MRI images • Used ImageMagik to change the size of the pictures to be 120 X 120
Results • Number of centers = 6
Results • Number of Centers = 19
Results • Number of Centers = 17
Results • Want to compare the variance of each cluster. • The variance in each cluster should be about the same.
Overview • Importance and use • K means cluster algorithm • The changes and adaptation I used • Results • Conclusions and Future Work
Conclusions and Future Work • A method to find the centers of the clusters • The parameters for threshold and span • Supersampling instead of using just one pixel.