Download
1 / 28
280 likes | 379 Views
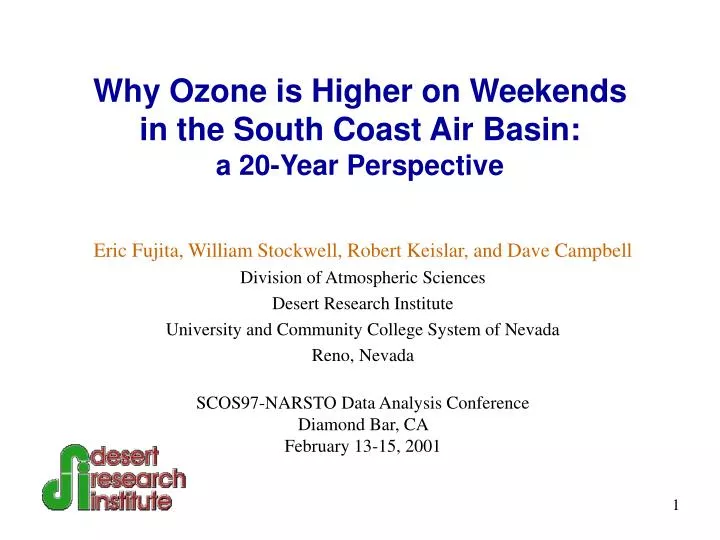
Why Ozone is Higher on Weekends in the South Coast Air Basin: a 20-Year Perspective. Eric Fujita, William Stockwell, Robert Keislar, and Dave Campbell Division of Atmospheric Sciences Desert Research Institute University and Community College System of Nevada Reno, Nevada

E N D
Why Ozone is Higher on Weekendsin the South Coast Air Basin:a 20-Year Perspective Eric Fujita, William Stockwell, Robert Keislar, and Dave Campbell Division of Atmospheric Sciences Desert Research Institute University and Community College System of Nevada Reno, Nevada SCOS97-NARSTO Data Analysis Conference Diamond Bar, CA February 13-15, 2001 1
Trends in Average Maximum 1-Hour Ozone from 1980 to 1997 in Western, Central and Eastern South Coast Air Basin Western: Los Angeles - N. Main, Lynwood, N. Long Beach, Anaheim, and La Habra Central:Azusa, Glendora, Pomona, and Upland Eastern: Riverside and Lake Gregory. 7
Trend in Number of Annual Exceedances of the Federal 1-hour Ozone Standard in the South Coast Air Basin from 1976 to 1999 6
Average Daily Maximum Ozone (ppb) in the SoCAB June to October
Average Daily Maximum Ozone (ppb) in the SoCAB June to October
Average Diurnal Variations in Ozone and HC/NOx Ratios at Azusa in Summer 1995
Twelve-site Average NO and NMHC (from CO) at 4-5 a.m. and 7-8 a.m. (PDT) by Day of the Week in the SoCAB during 1981 to 1998
Heavy-Duty Diesel Hydrocarbon Emission Rates Measured on Chassis Dynamometer from Mid-1970s to Mid-1990s for 4-Stroke Engines Source: Zielinska, 1999 Health Assessment Document for Diesel Emissions: Chapter 2 - Diesel Emissions, atmospheric concentrations, transport and transformation. U.S. EPA Office of Health and Environmental Assessment.
Heavy-Duty Diesel NOx Emission Rates Measured on Chassis Dynamometer from Mid-1970s to Mid-1990s for 4-Stroke Engines Source: Zielinska, 1999 Health Assessment Document for Diesel Emissions: Chapter 2 - Diesel Emissions, atmospheric concentrations, transport and transformation. U.S. EPA Office of Health and Environmental Assessment.
Twelve-Site Average NO2/NOx Ratios at 7-8 a.m. (PDT) by Day of the Week
3-Year Running Averages of Ozone Accumulation Rates (ppb/hr) in the South Coast Air Basin for Sunday and Wednesday
Duration and Rate of Ozone Accumulation on Wednesday During for 1981 - 1984
Duration and Rate of Ozone Accumulation on Sunday During for 1981 - 1984
3-Year Running Averages of Ozone Accumulation Rates (ppb/hr) in the South Coast Air Basin for Sunday Minus Wednesday
High VOC/NOx Low VOC/NOx NO2 + h = O + NO O + O2 + M = O3 + M O3 + NO = NO2 + O2
FINDINGS • O3 inhibition ends about 0.5 to 0.7 hours earlier on Saturdays and about 1.1 to 1.3 hours earlier on Sundays. • O3 inhibition ends earlier in downwind areas and later in areas of highest density of NO emissions. • The magnitude and spatial patterns of the ozone inhibition periods has not changed significantly between 1981 to 1998. • Duration of O3 accumulation is shortest in the western basin and longest in the eastern basin. • Timing of maximum [O3] has not changed over the last two decades in downwind areas of the basin, but has shifted about 1 to 1.5 hours later in the western and central basin. • Timing of maximum [O3] does not vary significantly by day of the week.
FINDINGS (Continued) • During 1981-84, O3 accumulation rates were highest in the central basin and higher on WDs than WEs at all sites. By 1995-98, rates were highest in the eastern basin and higher on WEs than WDs in most of the basin. • On average, O3 accumulation rates were cut in half during the 18-year period with largest reductions in the central basin. • Lower weekend O3 accumulation rates in the 1980s offset shorter O3 inhibition periods on WEs at central and eastern locations resulting in either no change or slightly lower [O3] on WEs (i.e., no weekend effect). • In the 1990s, the O3 accumulation rates were generally higher on WEs than WEs. Coupled with shorter inhibition periods, [O3] was consistently higher on weekends during the 1990s. • A switch from lower to higher O3 accumulation rates on WEs relative to WDs coincides with an increase in the magnitude and spatial extent of the weekend effect.
FINDINGS (Continued) • VOC/NOx 6-9 a.m.(Sat)/VOC/NOx 6-9 a.m.(Wed) ~ 1.05, 1.06, 1.17, and 1.18 VOC/NOx 6-9 a.m.(Sun)/VOC/NOx 6-9 a.m.(Wed) ~ 1.10, 1.17, 1.27 and 1.42 for 1981-84, 1985-89, 1990-94, and 1995-98, respectively. Similar differences in VOC/NOx ratios during time of maximum ozone. • VOC/NOx 6-9 a.m. during the 1990s are about 7 on weekdays, 8-9 on Saturdays and 9-10 on Sundays. Corresponding ratios at maximum [O3] are 10-11 on weekdays, 12-13 on Saturdays, and 13-14 on Sundays. • While greater carryover of VOC on weekends contributes to larger weekend morning VOC/NOx ratios, most of the increase is due to lower NO emissions during weekend mornings.
Status of ProjectWeekend/Weekday Ozone Observationsin the South Coast Air Basin • PHASE I: Retrospective Analysis of Ambient and Emissions Data and Refinement of Hypotheses • Draft Report 8/23/00 • Final report 12/29/00 • PHASE II: Field Measurements • Conducted field measurements in late-September to early-October, 2000 • Data Report on 4/15/01 • PHASE III: Data Analysis and Final Report • Draft Reports on 8/15/01 • Synthesis of Results and final report due 11/15/01
Acknowledgments • Douglas Lawson, National Renewable Energy Laboratory • Brent Bailey, Coordinating Research Council • Desert Research Institute • Barbara Zielinska, John Sagebiel, Mark McDaniel, Wendy Goliff, Larry Sheetz, and Mike Keith – Organic Analytical Laboratory • John Bowen • California Air Resources Board • CCOS and CRPAQS • Monitoring and Laboratory Division • Research Division and Technical • Bay Area Air Quality Management District • South Coast Air Quality Management District