Download
1 / 29
290 likes | 399 Views
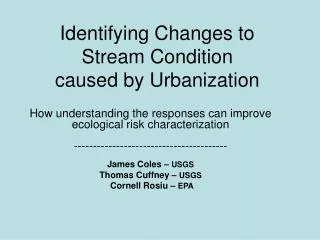
Identifying Changes to Stream Condition caused by Urbanization. How understanding the responses can improve ecological risk characterization ---------------------------------------- James Coles – USGS Thomas Cuffney – USGS Cornell Rosiu – EPA.

E N D
Identifying Changes to Stream Condition caused by Urbanization How understanding the responses can improve ecological risk characterization ---------------------------------------- James Coles – USGS Thomas Cuffney – USGS Cornell Rosiu – EPA
National Water-Quality Assessment (NAWQA) Program Urban Stream Studies Seattle Portland BOSTON Milwaukee Salt Lake City Sacramento Denver Raleigh Atlanta Birmingham Dallas Boston = NECB New England Coastal Basins
Setting up the Study Design • Define homogeneous environmental setting. • minimize natural variability • Determine watershed indicators of urbanization. • related to human presence • Select sites to represent urban intensity gradient. • minimal to high levels of urbanization • Establish consistent sampling reaches • 150 meters, riffles, riparian cover, stable channel
New England Study Sites BOSTON
Develop an Index to measure Urban Intensity Low Urban (0) High Urban (100) and which also corresponds to stream condition
Original (a priori) Index of Urban Intensity (UII) used 24 landuse and demographic variables to characterize an urbanizing landscape. Infrastructure (Dams, Roadways, TRI sites) Land cover (Forest, Developed land) Census statistics(Population, Socioeconomic factors)
Perhaps an Index of Urban Intensity (UII)could be derived that is as effective,but uses fewer than 24 variables Revised UII • Road Density • Expansion of Infrastructure • Percentage of Buffer in Forest • Encroachment along riparian zone • Percentage of Developed land • Change from natural landscape • Population Density • Human presence on landscape
Comparing theUrban Intensity Indices (UII) a prioi UII (24 variables) revised UII (4 variables)
Comparing responses of Indicator Variables between versions of the UII
NOAA ISA revised - UII a priori UII Impervious Surface Area (ISA) compared to Revised and the a priori UII r2=0.948 r2=0.982
40 Y= 0.37X + 0.91 R2 = 0.982 30 Percentage ISA 20 10 0 0 20 40 60 80 100 Urban Intensity Impervious Surface Areacompared to Urban Intensity (revised UII)
Invertebrate responses to urbanization (Urban Intensity scaled 0 to 100)
Response of Functional Group and Taxa Tolerance Threshold Response Linear Response
4 3 WQ Index (enrichment) 2 1 0 0 20 40 60 80 100 Urban Intensity Response of Water Quality to Urbanization Parameters in WQ index: - TKN - pH - Conductance - Alkalinity
Improving Ecological Risk AssessmentsThe value of knowing the urban intensity of a site where contamination occurs.(Is it urban intensity or the Superfund-site that is affecting stream condition?)
Eastland Woolen Mill SiteA Superfund Site in Corinna, ME. 3 Reference (Lake) 25 Correspondence Analysis, interpretation of the biplot : The two sets of reference sites are distinct from the group that has the contaminated sites. 27 26 2 CA - Axis 2 1 Reference (River) Contaminated 0 22 23 24 -1 -1 0 1 2 3 4 CA - Axis 1
Urban Intensity used to define the expected condition Large dot represents the Nyanza Superfund site. The Ecological Condition metric indicates that the cleanup was successful.
Developing Applications of the Urban intensity Index Addressing the details • Variables used in an urban index can be somewhat esoteric: Socioeconomic factors • The Urban Intensity Index is standardized over the range of study sites, scaled 0 -100. • Results from a single study of 30 sites may be tentative. Other data could be used to corroborate the Urban Intensity Index and the ecological responses.
Set up the equation to include the Landuse Variables Urban Intensity = (ROAD*12.5)+(BUFF%*1.74)+(DEV%*1.53)+(POP *8.09))*0.25) • ROAD = road density [road length (km) / watershed area (km2)] • BUFF% = percentage stream buffer not in forest landcover [MRLC level 1] • DEV% = percentage watershed in developed landcover [MRLC level 1] • POP = population density, people per hectare [U.S. census data]
120 100 Y = 0.97X + 13.6 80 Urban Intensitymodel 60 40 20 0 0 40 60 80 100 20 Urban intensity (scaled) Urban Intensity Indexmodeled vs. scaled Intercept
Regressions between response variables and the urban intensity index Response Regression Variable Coefficient (r2) _________________________________________________________________________________________________________ EPT Richness (-) 0.743 % Richness non-Insects (+) 0.837 Taxa Tolerance Index (+) 0.824 WQ Index (+) 0.834 __________________________________________________________
Expected stream condition based on Urban Intensity of watershed 6 5 4 Taxa Tolerance (Expected) 3 2 1 0 0 40 60 80 100 20 Urban intensity
Expected stream condition based on Urban Intensity of watershed 6 Acme Chemical Site • Urban Intensity = 40 5 4 Taxa Tolerance (Expected) 3 2 1 0 0 40 60 80 100 20 Urban intensity
Expected stream condition based on Urban Intensity of watershed 6 Acme Chemical Site • Urban Intensity = 40 • Stream Condition = 2.5 5 4 Taxa Tolerance (Expected) 3 2 1 0 0 40 60 80 100 20 Urban intensity
Expected stream condition based on Urban Intensity of watershed 6 Acme Chemical Site • Urban Intensity = 40 • Stream Condition = 2.5 CONCLUSION No unacceptable ecological risk 5 4 Taxa Tolerance (Expected) 3 2 1 0 0 40 60 80 100 20 Urban intensity
Expected stream condition based on Urban Intensity of watershed 6 Acme Chemical Site • Urban Intensity = 40 • Stream Condition = 4.5 CONCLUSION Stream condition may be affected by site contamination. 5 4 Taxa Tolerance (Expected) 3 2 1 0 0 40 60 80 100 20 Urban intensity
Concluding Points • Study currently being funded by EPA Region I (New England) to use this approach, which is expected to improve Ecological Risk Characterizations. • Even a general awareness of the urban intensity of a basin is useful in making an interpretation of stream condition at a site.