Download
1 / 19
190 likes | 194 Views
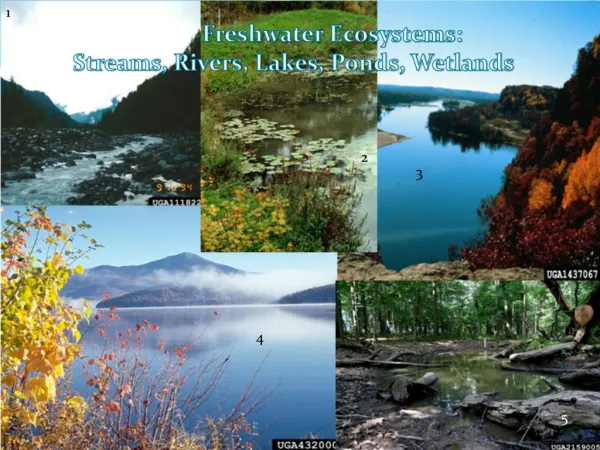
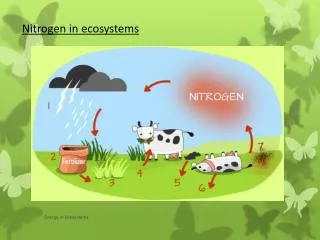
Nitrogen in Lakes and Streams. Wetzel Chapter 12 pp. 205-237. Joe Conroy 12 April 2004. Introduction. Where does the Nitrogen come from? Biological Fixation By bacteria and Cyanobacteria Lightning Fixation Reduction of N 2 in the atmosphere Human Fixation Crop production

E N D
Nitrogen in Lakes and Streams Wetzel Chapter 12 pp. 205-237 Joe Conroy 12 April 2004
Introduction • Where does the Nitrogen come from? • Biological Fixation • By bacteria and Cyanobacteria • Lightning Fixation • Reduction of N2 in the atmosphere • Human Fixation • Crop production • Energy Production
Forms: Dissolved N2 Oxidation State = 0 Ammonia NH4+ Oxdn State = -3 Nitrate NO3- Oxdn State = +6 Nitrite NO2- Oxdn State = +3 Organic Nitrogen Various States Sources Precipitation Fixation Surface/Groundwater Drainage Losses Effluent Outflow Reduction with loss of gaseous N2 Adsorption with Sedimentation Sources and Forms of N in Water
Nitrogen Fixation • Bacterial • Cyanobacterial • Only forms with heterocysts are capable of N-fixation • N-fixation mainly light-dependent • Requires reducing power and ATP • Both of these come from photosynthesis • Expensive energetically – 12-15mol ATP: 1mol N2 reduced • Dark rate <10% of light rates
Nitrogen Fixation continued • N-fixation curve follows the same path as the photosynthesis curve • Photosynthetic and Heterotrophic bacteria may also contribute to the fixed N pool • Fixation by shrubs on wetland, river, and lake shores can also contribute to N in water
Inorganic and Organic Nitrogen • Influents bring significant sources of N into lakes and streams • Common Amounts in Lakes • NH4 – 0-5mgL-1; higher in anaerobic hypolimnion of eutrophic waters • NO2-N – 0-0.01mgL-1; possibly higher in interstitial waters of deep sediments • NO3-N – 0-10mgL-1; highly variable seasonally and spatially • Organic N – up to 50% of Total Dissolved N
Inorganic and Organic N continued • [N] affect algal productivity but more likely that [P] limits • Growth rates for algae are higher with more reduced forms: NH4-N>NO3-N>N2-N
Generation and Distribution of Various Forms of Nitrogen • Ammonia • Deamination of organic material • Present in non-oxygenated areas • Low concentration in trophogenic zone • Sorbs to particles/sediments out • Higher at sediment interface • Adsorptive properties of sediments under anoxic conditions • Excretion products of benthic heterotrophs Variation by lake status
Generation and Distribution continued • Nitrification – biological conversion of N from a reduced to an oxidized state NH4++3/2O22H++NO2-+H20 G0=-66kcalmol-1 • Nitrosomonas bacterium NO2-+1/2O2NO3- G0=-18kcalmol-1 • Nitrobacterbacterium NOTE: less energy is given off by this oxidation • Overall: NH4++2O2NO3-+H20+2H+ Need oxygen for this reaction
Generation and Distribution continued • Denitrification – biochemical reduction of oxidized nitrogen anions with concomitant oxidation of organic matter • Occurs in both aerobic and anaerobic areas but is highly important under anerobic conditions • Examples: C6H12O6+12NO3-12NO2-+6CO2+6H20 G0=-460kcalmol-1
Seasonal Distribution • Interaction of Stratification, Anoxia, and Circulation with Biology control distributions
Carbon:Nitrogen Ratios • Indicative of nutrient availability but also of relative amount of proteins in organic matter • Approximate indication of phytoplankton status • C:N >14.6 – nitrogen limitation • Nitrogen-Fixing phytoplankton become more abundant • C:N <8.3 – no N-deficiency
Nitrogen Cycle in Streams and Rivers • Nutrient Spiraling – net flux downstream of dissolved nutrients that can be recycled over and over while moving downstream • Spiraling Length (S) – average distance a nutrient atom travels downstream during one cycle through the water and biotic compartments • S = distance traveled until uptake (Sw uptake length) + distance traveled within biota until regenerated (SB turnover length)
Conclusions • Nitrogen is very important to aquatic ecosystem function • Different forms occur at different times and depths • Occurrence controlled by the interaction between Biology, Chemistry, and Physics