Download
1 / 53
530 likes | 682 Views
Comparison of Meat and Dairy Projections. USDA, FAPRI, and OECD. Overview. This presentation will examine differences in the baseline projections for meat and dairy from USDA, OECD, and FAPRI. The main focus of the comparisons will be production and trade for major countries.

E N D
Comparison of Meat and Dairy Projections USDA, FAPRI, and OECD
Overview • This presentation will examine differences in the baseline projections for meat and dairy from USDA, OECD, and FAPRI. • The main focus of the comparisons will be production and trade for major countries. • Overall trends in trade will be examined because of reporting differences in each baseline.
Overview • World meat production continues to increase. • World meat trade also increases. • Some suppliers gain at the expense of others. • World milk production continues to increase. • However, world trade in dairy products remains flat, with one exception.
Conditional Comparisons • Baseline comparisons of production and trade are difficult because of the coverage of each model. • Trade in these baselines is projected as net trade or exports and imports. • USDA and OECD reports trade as imports and exports • FAPRI reports net trade. • Even with these differences we can examine trends in trade.
Beef Trade • USDA projections were done before the BSE discovery in the US. • OECD and FAPRI projections include the impact of BSE in the US. • The effect of the BSE in both projections are short lived.
FAPRI Beef Export Shares 2003 and 2013 • New Zealand, Brazil, Canada, and The Rest of the World (ROW) lose market share as exporters. • Australia and Argentina gain market share. • The US becomes a net exporter by 2013
USDA Beef Export Shares 2003 and 2013 • USDA show the US and Brazil gaining market share. • Australia, the EU, Argentina, and Canada lose market share 2013 2003
OECD Beef Export Market Share Projections 2003 and 2013 • Markets shares remain little changed. • Canada and Argentina gain market share. • EU and New Zealand lose share.
FAPRI Beef Import Market Share Projections 2003 and 2013 • Very little change in market shares. • Mexico imports a larger share. • The US becomes an net exporter.
OECD Beef Import Market Shares 2003 and 2013 • US becomes a net exporter. • Mexico and Japan increase their share of imports.
USDA Beef Import Market Share Projections 2003 and 2013 • The US becomes a net exporter. • Russia and Mexico import a larger share of world beef trade. • Other importers are little changed.
Beef Projections • USDA, FAPRI, and OECD have beef trade increasing. The difference is the source of the beef. • USDA shows Brazil and the US increasing export market share at the expense of Argentina and Australia. • FAPRI shows growth in Argentinean and Australian exports.
Beef Summary • All projections are consistent with growth in production and trade. • All three projections see growth in the same set of importers. • The source of the beef trade is where the projections differ.
Pork Projections • World Pork Production increases over the baseline in all projections.
FAPRI Pork Export Market Shares 2003 and 2013 • FAPRI Shows a large decline in the EU Export market share which is a function of enlargement. • Canada, the US, and Brazil gain market share. • China becomes a net importer
USDA Pork Export Market Shares 2003 and 2013 • Pork exporter market shares also remain little changed.
OECD Pork Export Market Shares 2003 and 2013 • OECD shows EU25 and US with increasing market share. • China and Brazil show minor declines
FAPRI Pork Import Market Share 2003 and 2013 • FAPRI show the Rest of the World gaining market share at the expense of Russia. • All other importers’ shares are little changed.
USDA Pork Import Market Shares 2003 and 2013 • Import market shares remain little changed over the baseline. • Russian and Japan shares decline as the Rest of the World increases.
OECD Pork Import Market Shares 2003 and 2013 • The OECD shows the US and Korean market share increasing.
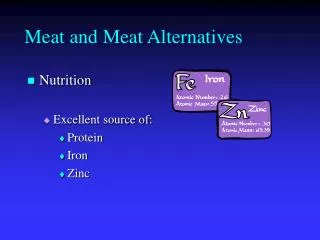
Poultry Projections • USDA projections are for all Poultry (chickens, turkeys, etc) • FAPRI and OECD are just Broilers. • Poultry production continues to increase in all of the projections. • Russia is assumed use their Poultry Quota • USDA assumes that the Quota is in place until 2006.
OECD Poultry Export Market Shares 2003 and 2013 • The OECD has the US increasing market share at the expense of Brazil and China.
FAPRI Poultry Export Market Shares 2003 and 2013 • FAPRI shows the US and Brazil increasing their market share. • The EU shows a decline in market share.
USDA Poultry Export Market Shares 2003 and 2013 • USDA market share projections remain little changed. • Brazil shows a small growth in market share. • China’s market share declines.
OECD Poultry Import Market Share 2003 and 2013 • China, Japan, and Mexico increase their market shares. • There is a large decline in the market share of the Rest of the World.
FAPRI Poultry Import Market Shares 2003 and 2013 • Russian import market share declines as the TRQ is in effect.
USDA Poultry Export Market Shares 2003 and 2013 • Rest of the World import market shares increase. • Declines are seen in Japan, the EU, and Russia.
Dairy • World Dairy Production continues to grow. • Trade in most dairy products remain flat to slightly increasing. • Whole Milk Powder and Cheese are the only interesting growth markets in the dairy sector.
OECD Butter Exports • New Zealand Butter exports increase as the world exports remain flat.
FAPRI Butter Exports • New Zealand and Australian Butter exports increase as the world exports remain flat.
FAPRI Cheese Exports • Cheese Exports remain fairly flat over the baseline period.
OECD Cheese Exports • Cheese Exports continue to increase • All major exporters show and increase
OECD SMP Exports • New Zealand expands Skim Milk Power exports
FAPRI SMP Exports • Australia and New Zealand expand Skim Milk Powder exports
FAPRI WMP Production • Whole Milk Powder production continues to increase in major exporting countries.