Download
1 / 20
200 likes | 288 Views
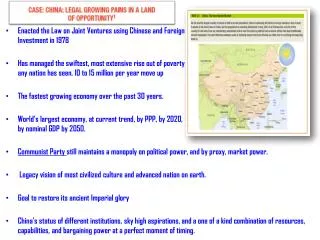
Transportation Operations Goals and Accomplishments. Institute of Transportation Engineers 2001 Spring Conference and Exhibit Dr. Christine Johnson D irector, ITS Joint Program Office Program Manager, FHWA Operations March 28, 2001. Congestion has reached a boiling point.

E N D
Transportation Operations Goals and Accomplishments Institute of Transportation Engineers 2001 Spring Conference and Exhibit Dr. Christine JohnsonDirector, ITS Joint Program OfficeProgram Manager, FHWA OperationsMarch 28, 2001
Congestion has reached a boiling point Congestion is the No 1 political priority - Rep Young …and people want more information to help them cope
In this past year…. • Dimensions of the problem • What is required for “peak operating performance” • Legislative Options
Dimensioning the Problem: Congestion • 1980-1998 • Vehicle travel up 72%Road Miles up 1%
Dimensioning the Problem:Congestion • 46% of peak period travel is congested • 4.3 billion hours wasted • No longer a big city problem • Congestion in small areas grew 400%
Take Back The Road Operations Disasters 4 Lanes of Highway Weather Work Zones Incidents Demand Management
Dimensioning the Problem:Incident Management • 60% of the Peak? • 1:4 clearance to traffic back up • Cost of wrong response? • Benchmarks?
Dimensioning the Problem: Work Zones Top of American’s traffic frustration list! American’s top three traffic improvements are work zone related. 1 of every 5 state miles in California is under construction!
Its not the money for Maintenance It’s the time!
Dimensioning the Problem: Weather • 50% of U.S population run 5% risk of hurricanes • 69% of Americans in snow belt • 74% of NHS in snow belt • A day long weather shutdown - $15-$93 million
What is it going to take to achievePeak Performance? 1. Raise the bar of individual activities 2. Integrate 3. Tools and data 4. Performance Measure 5. Communicate with the public 6. Spend the money
Peak Performance Raising the Bar • Operations Self Assessment • Signal Timing Video • Incident Management Guidance • Public Safety Initiative
Peak Performance Raising the Bar 5+ Million d(i) 10 BIG IMPACT • Work Zone Hassle Index • Divides delay by life of improvement • Integrating weather information with traffic signal timing 1 Million- 5 Million d(i) 9 500,000- 1 Million d(i) 8 100,000- 500,000 d(i) 7 10,000- 100,000 d(i) 6 5 5,000-10,000 d(i) 1000-5,000 d(i) 4 SMALL IMPACT 3 500-1000 d(i) 100-500 d(i) 2 0-100 d(i) 1 d(i) = degree of impact 36
Peak Performance Integration • Architecture Rule • The Long Range Plan for Operations • Required in 4 years • Brings right players to table • 511 • Public will demand seamless information
Peak Performance Tools • Turbo Architecture • IDAS • Quick Zone • NGSIM • Decision Support Tools
Trends in On-Time Arrival Reliability in Washington DC 98% 97% 93% Percentage of On-Time Arrivals 88% ATIS Driver Habitual Driver Date 29 Peak Performance Measures
Peak Performance Communicate with Customer • 511 – DOT a phone call away • Quality • Accuracy • Capacity At least I called ahead and delayed the meeting Consider an award for the best traffic web site?
Peak Performance Spend the Money • Baseline data • States relatively flat 5-6% • Cities have grown from 3% to nearly 7% • Launched Survey • Are we spending enough? • Does operations compete well?
Legislative Options • Data – Minimum data collecting capability on NHS • Institutional Development • Policy - Provide for three distinct missions • Money