Download
1 / 10
100 likes | 225 Views
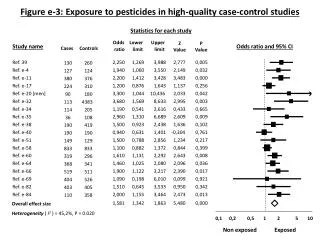
Statistics for each study. Odds. Lower. Upper. Z Value. P Value. Study name. Odds ratio and 95% CI. Cases. Controls. ratio. limit. limit. Ref. 39. 2,250. 1,269. 3,988. 2,777. 0,005. 130. 260. Ref. e-4. 1,940. 1,060. 3,550. 2,149. 0,032. 127. 124. Ref. e-11. 2,200.

E N D
Statistics for each study Odds Lower Upper Z Value P Value Study name Odds ratio and 95% CI Cases Controls ratio limit limit Ref. 39 2,250 1,269 3,988 2,777 0,005 130 260 Ref. e-4 1,940 1,060 3,550 2,149 0,032 127 124 Ref. e-11 2,200 1,412 3,428 3,483 0,000 380 376 Ref. e-17 1,200 0,876 1,643 1,137 0,256 224 310 Ref. e-20 [men] 3,300 1,044 10,436 2,033 0,042 90 180 Ref. e-32 3,680 1,569 8,633 2,995 0,003 113 4383 Ref. e-34 1,190 0,541 2,616 0,433 0,665 114 205 Ref. e-35 2,960 1,310 6,689 2,609 0,009 36 108 Ref. e-38 1,500 0,923 2,438 1,636 0,102 190 419 Ref. e-40 0,940 0,631 1,401 -0,304 0,761 190 190 Ref. e-51 1,500 0,788 2,856 1,234 0,217 149 129 Ref. e-58 1,100 0,882 1,372 0,844 0,399 833 833 Ref. e-60 1,610 1,131 2,292 2,643 0,008 319 296 Ref. e-64 1,460 1,025 2,080 2,096 0,036 368 341 Ref. e-66 1,900 1,122 3,217 2,390 0,017 519 511 Ref. e-69 1,090 0,198 6,010 0,099 0,921 404 526 Ref. e-82 1,510 0,645 3,533 0,950 0,342 403 405 Ref. e-84 2,000 1,155 3,464 2,473 0,013 110 358 Overall effect size Heterogeneity ( I2 ) = 45,2%, P = 0.020 1,581 1,342 1,863 5,480 0,000 0,1 0,2 0,5 1 2 5 10 Non exposed Exposed Figure e-3: Exposure to pesticides in high-quality case-control studies
Statistics for each study Odds Lower Upper Z Value P Value Study name Odds ratio and 95% CI Cases Controls ratio limit limit Ref. e-2 130 2,830 1,132 7,074 2,226 0,026 260 Ref. e-4 127 0,930 0,539 1,606 -0,260 0,795 124 Ref. e-11 113 2,090 1,458 2,996 4,012 0,000 69 Ref. e-42 250 1,090 0,773 1,536 0,492 0,623 388 Ref. e-51 [men] 90 1,200 0,384 3,747 0,314 0,754 73 Ref. e-58 833 1,240 0,931 1,652 1,471 0,141 833 Ref. e-60 319 1,590 0,998 2,534 1,950 0,051 296 Ref. e-63 223 1,350 0,764 2,384 1,034 0,301 556 Ref. e-82 403 1,330 0,598 2,959 0,699 0,485 405 Ref. e-83 249 0,870 0,396 1,910 -0,347 0,729 369 Overall effect size Heterogeneity ( I2 ) = 33,3%, P = 0.141 1,355 1,110 1,655 2,986 0,003 0,1 0,2 0,5 1 2 5 10 Non exposed Exposed Exposure to herbicides in high-quality case-control studies
Statistics for each study Odds Upper Lower Z Value P Value Study name Odds ratio and 95% CI Cases Controls ratio limit limit Ref. 39 2,050 4,075 1,031 2,048 0,041 130 127 Ref. e-4 0,380 0,694 0,208 -3,150 0,002 127 124 Ref. e-11 2,070 2,877 1,489 4,331 0,000 113 69 Ref. e-20 [men] 2,200 9,526 0,508 1,054 0,292 90 180 Ref. e-42 0,820 1,150 0,585 -1,151 0,250 250 388 Ref. e-51 [men] 2,500 10,104 0,619 1,286 0,198 90 73 Ref. e-58 0,950 1,220 0,740 -0,402 0,688 833 833 Ref. e-60 1,830 2,800 1,196 2,784 0,005 319 296 Ref. e-63 1,910 3,353 1,088 2,253 0,024 220 548 Ref. e-82 1,260 2,739 0,580 0,583 0,560 403 405 Overall effect size Heterogeneity ( I2 ) = 79,2%, P < 0.001 1,307 1,859 0,918 1,485 0,137 0,1 0,2 0,5 1 2 5 10 Non exposed Exposed Exposure to insecticides in high-quality case-control studies
Statistics for each study Odds Lower Upper Z Value P Value Study name Odds ratio and 95% CI Cases Controls ratio limit limit 260 Ref. 39 130 1,630 0,809 3,285 1,366 0,172 124 Ref. e-4 127 0,490 0,267 0,900 -2,301 0,021 388 Ref. e-42 250 0,550 0,289 1,047 -1,821 0,069 833 Ref. e-58 833 0,870 0,453 1,671 -0,418 0,676 549 Ref. e-63 220 2,050 0,920 4,569 1,755 0,079 405 Ref. e-82 403 1,180 0,349 3,989 0,266 0,790 369 Ref. e-83 249 0,940 0,349 2,534 -0,122 0,903 Overall effect size Heterogeneity ( I2 ) = 54,2%, P = 0.041 0,937 0,612 1,435 -0,300 0,764 0,1 0,2 0,5 1 2 5 10 Non exposed Exposed Exposure to fungicides in high-quality case-control studies
Statistics for each study Odds Lower Upper Z Value P Value Study name Odds ratio and 95% CI Cases Controls ratio limit limit Ref. e-4 127 1,740 0,993 3,049 1,935 0,053 124 Ref. e-11 380 1,800 1,200 2,700 2,841 0,004 376 Ref. e-34 114 1,790 0,250 12,798 0,580 0,562 205 Ref. e-69 404 1,220 0,709 2,098 0,719 0,472 526 Ref. e-79 99 1,700 0,790 3,656 1,358 0,174 99 Ref. e-83 249 1,100 0,395 3,065 0,182 0,855 369 Overall effect size Heterogeneity ( I2 ) = 0,0%, P = 0.861 1,583 1,229 2,040 3,555 0,000 0,1 0,2 0,5 1 2 5 10 Non exposed Exposed Statistics for each study Z Value P Value Odds Lower Upper Study name Odds ratio and 95% CI Cases Controls ratio limit limit Ref. e-4 127 0,780 0,440 1,381 -0,852 0,394 124 Ref. e-11 380 5,800 1,103 30,491 2,076 0,038 376 Ref. e-60 319 1,990 1,089 3,637 2,237 0,025 296 Ref. e-68 [men] 101 1,700 0,825 3,505 1,438 0,151 234 Ref. e-82 403 0,620 0,191 2,012 -0,796 0,426 405 Overall effect size Heterogeneity ( I2 ) = 60,6%, P = 0.038 1,389 0,772 2,499 1,097 0,273 0,1 0,2 0,5 1 2 5 10 Non exposed Exposed Exposure to solvents in high-quality case-control studies Exposure to organochlorines in high-quality case-control studies
Statistics for each study Odds Lower Upper Z Value P Value Study name Odds ratio and 95% CI Cases Controls ratio limit limit 124 Ref. e-4 [men] 127 0,640 0,350 1,170 -1,450 0,147 376 Ref. e-11 380 2,500 1,329 4,703 2,842 0,004 388 Ref. e-42 250 0,830 0,605 1,139 -1,154 0,249 296 Ref. e-60 319 1,890 1,105 3,234 2,323 0,020 249 Ref. e-63 [men] 98 1,500 0,849 2,652 1,395 0,163 405 Ref. e-82 403 0,740 0,198 2,759 -0,448 0,654 Overall effect size Heterogeneity ( I2 ) = 72,2%, P = 0.003 1,221 0,782 1,908 0,877 0,380 0,1 0,2 0,5 1 2 5 10 Non exposed Exposed Statistics for each study Odds Lower Upper Z Value P Value Study name Odds ratio and 95% CI Cases Controls ratio limit limit 60 Ref. e-4 [men] 71 1,250 0,339 4,613 0,335 0,738 511 Ref. e-66 519 2,800 0,808 9,699 1,624 0,104 326 Ref. e-69 [men] 252 0,900 0,145 5,605 -0,113 0,910 358 Ref. e-84 110 2,600 1,390 4,864 2,990 0,003 341 Ref. e-85 341 1,500 1,031 2,182 2,120 0,034 Overall effect size Heterogeneity ( I2 ) = 0,0%, P = 0.480 1,722 1,277 2,322 3,565 0,000 0,1 0,2 0,5 1 2 5 10 Non exposed Exposed Exposure to organophosphates in high-quality case-control studies Exposure to paraquat in high-quality case-control studies
Statistics for each study Odds Lower Upper Z Value P Value Study name Odds ratio and 95% CI Cases Controls ratio limit limit Ref. e-66 1,010 0,061 16,637 0,007 0,994 519 511 Ref. e-85 2,260 1,218 4,193 2,585 0,010 362 341 Overall effect size Heterogeneity ( I2 ) = 0,0%, P = 0.582 2,177 1,191 3,981 2,526 0,012 0,1 0,2 0,5 1 2 5 10 Non exposed Exposed Statistics for each study Lower Z Value P Value Odds Upper Study name Odds ratio and 95% CI Cases Controls limit ratio limit 0,395 Ref. e-69 [men] 0,800 1,620 -0,620 0,535 252 326 0,220 Ref. e-82 0,760 2,623 -0,434 0,664 403 405 0,680 Ref. e-84 1,100 1,779 0,389 0,698 110 358 Overall effect size Heterogeneity ( I2 ) = 0,0%, P = 0.705 0,664 0,970 1,416 -0,159 0,874 0,1 0,2 0,5 1 2 5 10 Non exposed Exposed Exposure to maneb/mancozeb in high-quality case-control studies Exposure to dichloro-diphenyil-trichloroethane in high-quality case-control studies
Statistics for each study Odds Lower Upper Z Value P Value Study name Odds ratio and 95% CI Cases Controls ratio limit limit Ref. 39 130 1,940 1,123 3,350 2,377 0,017 260 Ref. e-4 127 0,720 0,223 2,328 -0,549 0,583 124 Ref. e-10 62 0,600 0,288 1,249 -1,366 0,172 124 Ref. e-11 380 0,700 0,422 1,161 -1,382 0,167 376 Ref. e-20 [men] 90 1,400 0,678 2,891 0,909 0,363 180 Ref. e-32 113 1,200 0,725 1,985 0,710 0,478 4383 Ref. e-34 114 0,750 0,423 1,330 -0,985 0,325 205 Ref. e-35 36 1,690 0,781 3,656 1,333 0,183 108 Ref. e-44 196 1,100 0,618 1,957 0,324 0,746 196 Ref. e-60 319 1,110 0,800 1,540 0,625 0,532 296 Ref. e-63 224 1,900 1,272 2,838 3,136 0,002 557 Ref. e-66 519 1,100 0,775 1,561 0,534 0,593 511 Ref. e-69 404 1,170 0,756 1,811 0,705 0,481 526 Ref. e-82 403 2,360 1,227 4,539 2,573 0,010 405 Ref. e-83 249 0,950 0,415 2,175 -0,121 0,903 369 Overall effect size Heterogeneity ( I2 ) = 44,0%, P = 0.034 1,183 0,980 1,429 1,753 0,080 0,1 0,2 0,5 1 2 5 10 Non exposed Exposed Exposure to farming in high-quality case-control studies
Statistics for each study Odds Lower Upper Z Value P Value Cases Controls Study name Odds ratio and 95% CI ratio limit limit Ref. 34 104 230 1,070 0,568 2,014 0,210 0,834 Ref. e-4 127 124 0,920 0,515 1,645 -0,281 0,778 Ref. e-11 380 376 0,900 0,611 1,325 -0,534 0,593 Ref. e-17 224 310 0,600 0,386 0,934 -2,265 0,024 Ref. e-34 114 205 0,960 0,480 1,920 -0,115 0,908 Ref. e-40 190 190 0,930 0,595 1,453 -0,319 0,750 Ref. e-42 250 388 1,810 1,020 3,211 2,029 0,042 Ref. e-60 319 296 1,080 0,774 1,507 0,452 0,651 Ref. e-63 222 555 1,000 0,683 1,464 0,000 1,000 Ref. e-64 368 341 1,210 0,817 1,793 0,950 0,342 Overall effect size Heterogeneity ( I2 ) = 17,2%, P = 0.284 0,998 0,852 1,169 -0,023 0,982 0,1 0,2 0,5 1 2 5 10 Non exposed Exposed Exposure to well water drinking in high-quality case-control studies
Statistics for each study Odds Lower Upper Z Value P Value Study name Odds ratio and 95% CI Cases Controls ratio limit limit 257 Ref. 34 129 0,780 0,506 1,201 -1,127 0,260 310 Ref. e-17 224 1,700 1,147 2,520 2,643 0,008 190 Ref. e-40 190 0,950 0,603 1,497 -0,221 0,825 388 Ref. e-42 250 1,310 0,843 2,036 1,200 0,230 Overall effect size Heterogeneity ( I2 ) = 62,0%, P = 0.048 1,143 0,806 1,619 0,750 0,453 0,1 0,2 0,5 1 2 5 10 Non exposed Exposed Exposure to rural living in high-quality case-control studies


![FEASIBILITY STUDY FOR A [NAME OF BUSINESS]](https://cdn1.slideserve.com/1513744/feasibility-study-for-a-name-of-business-dt.jpg)
![FEASIBILITY STUDY FOR A [NAME OF BUSINESS]](https://cdn1.slideserve.com/1598546/feasibility-study-for-a-name-of-business-dt.jpg)

![[Insert Hospital Name] Timeline Study](https://cdn1.slideserve.com/2465432/slide1-dt.jpg)