Download
1 / 15
150 likes | 261 Views
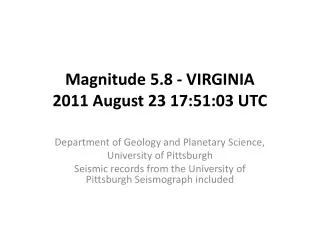
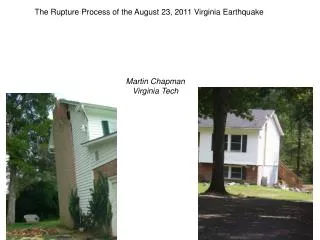
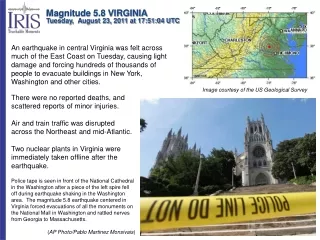
Magnitude 5.8 VIRGINIA Tuesday, August 23, 2011 at 17:51:04 UTC. An earthquake in central Virginia was felt across much of the East Coast on Tuesday, causing light damage and forcing hundreds of thousands of people to evacuate buildings in New York, Washington and other cities.

E N D
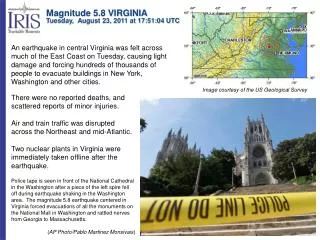
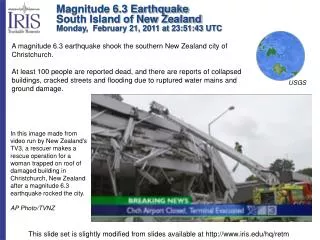
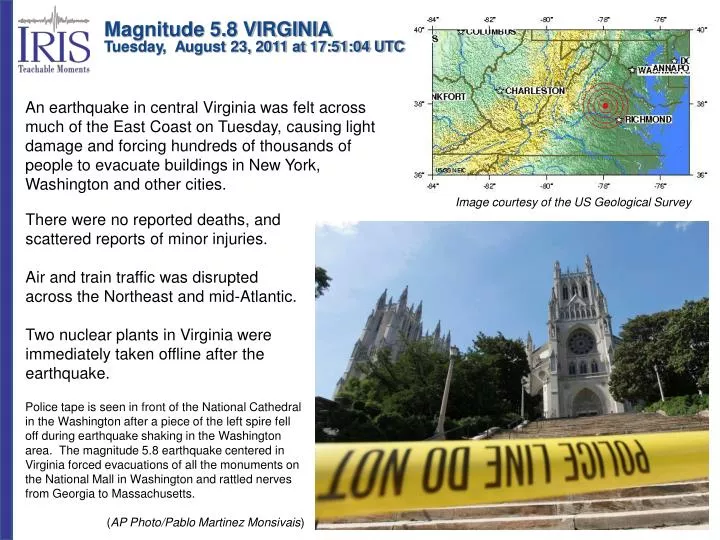
Magnitude 5.8 VIRGINIATuesday, August 23, 2011 at 17:51:04 UTC An earthquake in central Virginia was felt across much of the East Coast on Tuesday, causing light damage and forcing hundreds of thousands of people to evacuate buildings in New York, Washington and other cities. Image courtesy of the US Geological Survey There were no reported deaths, and scattered reports of minor injuries. Air and train traffic was disrupted across the Northeast and mid-Atlantic. Two nuclear plants in Virginia were immediately taken offline after the earthquake. Police tape is seen in front of the National Cathedral in the Washington after a piece of the left spire fell off during earthquake shaking in the Washington area. The magnitude 5.8 earthquake centered in Virginia forced evacuations of all the monuments on the National Mall in Washington and rattled nerves from Georgia to Massachusetts. (AP Photo/Pablo Martinez Monsivais)
Magnitude 5.8 VIRGINIATuesday, August 23, 2011 at 17:51:04 UTC A moderate earthquake occurred Tuesday at 01:51:04 PM local time 61 km (38 miles) NW from Richmond, VA and 135 km (84 miles) SW from Washington, DC. On this map, the earthquake (orange star) is plotted along with epicenters of earthquakes in the region since 1990. Since at least 1774, people in the Central Virginia region have felt small earthquakes and suffered damage from infrequent larger ones. The largest known damaging earthquake in this area occurred in 1875. The 1875 shock occurred before the invention of modern seismographs, but the felt area of the shock suggests that it had a magnitude of about 4.8. The largest historical earthquake in Virginia, with a magnitude of 5.8, occurred further to the west in 1897. Image courtesy of the US Geological Survey
Magnitude 5.8 VIRGINIATuesday, August 23, 2011 at 17:51:04 UTC Shaking intensity scales were developed to standardize the measurements and ease comparison of different earthquakes. The Modified-Mercalli Intensity scale is a twelve-stage scale, numbered from I to XII. The lower numbers represent imperceptible shaking levels, XII represents total destruction. A value of IV indicates a level of shaking that is felt by most people. Perceived Shaking Extreme Violent Severe Very Strong Strong Moderate Light Weak Not Felt Modified Mercalli Intensity Image courtesy of the US Geological Survey USGS Estimated shaking Intensity from M 5.8 Earthquake
Magnitude 5.8 VIRGINIATuesday, August 23, 2011 at 17:51:04 UTC USGS PAGER Population Exposed to Earthquake Shaking The USGS PAGER map shows the population exposed to different Modified-Mercalli Intensity (MMI) levels. MMI describes the severity of an earthquake in terms of its effect on humans and structures and is a rough measure of the amount of shaking at a given location. Overall, the population in this region resides in structures that are resistant to earthquake shaking. The color coded contour lines outline regions of MMI intensity. The total population exposure to a given MMI value is obtained by summing the population between the contour lines. The estimated population exposure to each MMI Intensity is shown in the table below. Image courtesy of the US Geological Survey
Magnitude 5.8 VIRGINIATuesday, August 23, 2011 at 17:51:04 UTC This earthquake was felt along the east coast from South Carolina to Maine. Shaking was felt as far away as Atlanta, Detroit, Canada, to as far west as Indiana. Shaking intensity reported through USGS “Did You Feel It?” While earthquakes in the eastern United States are less frequent than in the western United States, they are typically felt over a much broader region. Often times, an earthquake can be felt over an area as much as ten times larger than a similar magnitude earthquake on the west coast. This is due to the ease of wave propagation through the North American Craton (a craton is an old and stable part of the continental lithosphere).
Magnitude 5.8 VIRGINIATuesday, August 23, 2011 at 17:51:04 UTC Generalized Seismic Hazard This earthquake occurred as reverse faulting on a northeast-striking plane within a previously recognized seismic zone, the ‘Central Virginia Seismic Zone.’ The Central Virginia Seismic Zone has produced small and moderate earthquakes since at least the 18th century. Previous seismicity has not been associated with a single mapped fault and instead are thought to have occurred over an area with length and width of about 150 km defining the broad source region. Seismic Hazard is expressed as peak ground acceleration (PGA) on firm rock, in percent g, expected to be exceeded in a 50 year interval with a probability of two percent. Tarr, Arthur C., and Wheeler, Russell L., 2006, Earthquakes in Virginia and vicinity 1774 - 2004: U.S. Geological Survey Open-File Report 2006–1017.
Magnitude 5.8 VIRGINIATuesday, August 23, 2011 at 17:51:04 UTC Reverse Fault This earthquake occurred as reverse faulting on a northeast-striking plane within a previously recognized seismic zone in Central Virginia. While the seismic zone was known, individual faults are not well mapped, and often difficult to characterize until an earthquake has occurred along them. From the data recorded by seismometers following an earthquake, the fault that caused the earthquake can be characterized by orientation (strike) and the likely forces that caused the rock to break (fault type). A reverse fault is caused by compressional forces. Along a reverse fault, one rocky block is pushed up relative to rock beneath the fault. The strike is the trend or bearing, relative to north, of the line defined by the intersection of a planar geologic surface (in this example, the presumed fault surface) and a horizontal surface such as the ground. Image courtesy of the US Geological Survey Strike Image courtesy of Charles Ammon
Magnitude 5.8 VIRGINIATuesday, August 23, 2011 at 17:51:04 UTC US Geological Survey geophysicist Mary Lou Zoback has studied the state of stress in tectonic plates, especially the North American Plate. From hundreds of measurements of stress, she and coworkers compiled a map of stress provinces in the coterminous Unites States. The Atlantic Coast and adjacent interior portions of that map are shown. Notice that the direction of compression within the Atlantic Coast regional is oriented in a west-northwest to east-southeast direction. Interestingly, this earthquake was produced by thrust faulting with the direction of compression oriented west-northwest to east-southeast, consistent with the regional pattern on the US East Coast. Shaded areas show quadrants of the focal sphere in which the P-wave first-motions are away from the source, and unshaded areas show quadrants in which the P-wave first-motions are toward the source. The dots represent the axis of maximum compressional strain (in black, called the "P-axis") and the axis of maximum extensional strain (in white, called the "T-axis") resulting from the earthquake. M. L. Zoback and M. Zoback, State of Stress in the Coterminous United States, J. Geophys. Res., v. 85, p. 6113-6156, 1980. USGS WPhase Centroid Moment Tensor Solution
Magnitude 5.8 VIRGINIATuesday, August 23, 2011 at 17:51:04 UTC • So what accounts for the west-northwest to east-southeast direction of compression within the Atlantic Coast region? Several ideas have been proposed. On the scale of world plates, two forces dominate in pushing and pulling plates around. • One force is ‘ridge push’ that pushes plates away from the divergent plate boundaries at spreading ocean ridges. • The other dominant force is ‘slab pull’ or ‘trench pull’ that pulls subducting oceanic plates down into ocean trenches at convergent plate boundaries. Modified from UCSD
Magnitude 5.8 VIRGINIATuesday, August 23, 2011 at 17:51:04 UTC The North American Plate is moving away from the Mid-Atlantic Ridge toward the west-northwest. It is tempting to envision the west-northwest to east-southeast compression of the Atlantic Coast region as simply due to ridge push from the Mid-Atlantic Ridge. However, this direction of compression is also approximately perpendicular to the Appalachian Mountains and may be related to those mountains that resulted from collision between North America and Africa about 300 million years ago. As the Appalachian Mountains erode, the crust “rebounds” and flexes in a fashion that could contribute to stress within the Atlantic Coast region. Eurasian Plate North American Plate Earthquake African Plate The arrows show the motion of the North American Plate as it moves away (at a rate of 1.5 – 2 cm/year) from the Mid-Atlantic Ridge.
Magnitude 5.8 VIRGINIATuesday, August 23, 2011 at 17:51:04 UTC In addition, there are many faults in this region inherited from the formation of the Appalachians and the rifting of North America from Africa during the subsequent breakup of Pangaea about 200 million years ago. These old faults can be reactivated by stresses of ridge push or other origins and result in occasional earthquakes in the Atlantic Coast region. At well-studied plate boundaries like the San Andreas fault system in California, often scientists can determine the name of the specific fault that is responsible for an earthquake. In contrast, east of the Rocky Mountains this is rarely the case. The Pangaea Central Virginia Seismic Zone is far from the nearest plate boundaries, which are in the center of the Atlantic Ocean and in the Caribbean Sea. The seismic zone is laced with known faults but numerous smaller or deeply buried faults remain undetected. Even the known faults are poorly located at earthquake depths. Accordingly, few, if any, earthquakes in the seismic zone can be linked to named faults. It is difficult to determine if a known fault is still active and could slip and cause an earthquake. As in most other areas east of the Rockies, the best guide to earthquake hazards in the seismic zone is the earthquakes themselves (Source: USGS)
Magnitude 5.8 VIRGINIATuesday, August 23, 2011 at 17:51:04 UTC Movie showing seismic waves crossing the US recorded by the USArray. The circles in the movie represent earthquake recording stations and the color of each circle represents the amplitude, or height, of the earthquake wave detected by the station’s seismometer. The color of the circle changes as waves of differing amplitude travel past the seismometer. Blue represents downward ground motion, red represents upward ground motion, and darker colors indicate larger amplitudes. A random representative trace is displayed on the lower part of the animation with its horizontal axis representing the time (in seconds) after the event. Location of the representative station is marked on the map by a yellow circle. The above map shows the predicted (theoretical) travel times, in minutes, of the first compressional (P) wave from the earthquake across the United States. As earthquake waves travel along the surface of the Earth, they cause the ground to move. With the 400 earthquake recording stations in EarthScope’s Transportable Array, the ground motions can be captured and displayed as a movie, using the actual data recorded from the earthquake.
Magnitude 5.8 VIRGINIATuesday, August 23, 2011 at 17:51:04 UTC USArray: A Continental-Scale Seismic Observatory USArray’s transportable array is a network of 400 high-quality broadband seismographs that are moving (every two years) across the United States from west to east, and Alaska, in a regular grid pattern. These data are being used to answer questions about the North American continent and underlying mantle. Operating USArray Stations. The 400 active transportable array stations are plotted in red. Permanent stations are plotted in blue.
Magnitude 5.8 VIRGINIATuesday, August 23, 2011 at 17:51:04 UTC The record of the M5.8 Virginia earthquake on the University of Portland seismometer (UPOR) is illustrated below. Portland is about 3762 km (2350 miles, 33.90°) from the location of this earthquake. Following the earthquake, it took 6 minutes and 43 seconds for the compressional P waves to travel a curved path through the mantle from Virginia to Portland, Oregon. PP waves are compressional waves that bounce off the Earth’s surface halfway between the earthquake and the station. PP energy arrived 8 minutes after the earthquake. S and SS are shear waves that follow the same path through the mantle as P and PP waves, respectively. The S waves arrived 12 minutes and 9 seconds and SS waves arrived 14 minutes and 36 seconds after the earthquake. Surface waves, both Love and Rayleigh, travel the 3762 km (2350 miles) along the perimeter of the Earth from the earthquake to the recording station.
Magnitude 5.8 VIRGINIATuesday, August 23, 2011 at 17:51:04 UTC O56A 3 components recorded by O56A (0.01–0.07 Band Pass (BP) filtered), the closest USArray station to the event.