Download
1 / 13
130 likes | 287 Views
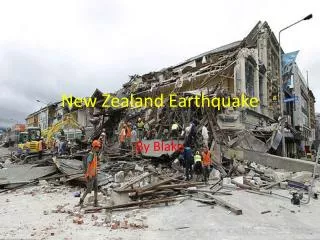
Magnitude 6.3 Earthquake South Island of New Zealand Monday, February 21, 2011 at 23:51:43 UTC. A magnitude 6.3 earthquake shook the southern New Zealand city of Christchurch.

E N D
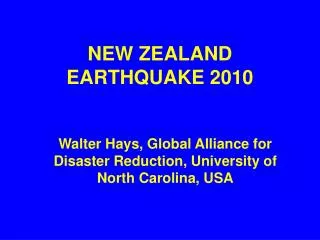
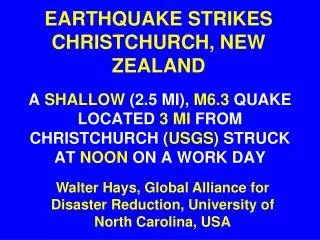
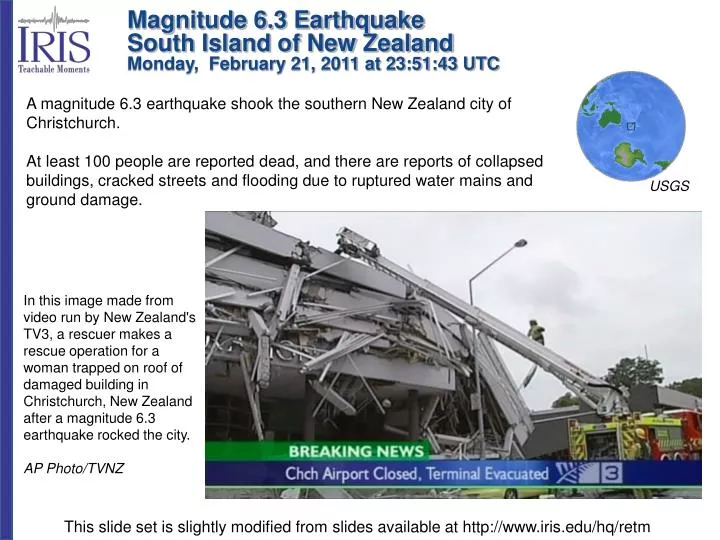
Magnitude 6.3 Earthquake South Island of New ZealandMonday, February 21, 2011 at 23:51:43 UTC A magnitude 6.3 earthquake shook the southern New Zealand city of Christchurch. At least 100 people are reported dead, and there are reports of collapsed buildings, cracked streets and flooding due to ruptured water mains and ground damage. USGS In this image made from video run by New Zealand's TV3, a rescuer makes a rescue operation for a woman trapped on roof of damaged building in Christchurch, New Zealand after a magnitude 6.3 earthquake rocked the city. AP Photo/TVNZ This slide set is slightly modified from slides available at http://www.iris.edu/hq/retm
Magnitude 6.3 SOUTH ISLAND OF NEW ZEALANDMonday, February 21, 2011 at 23:51:43 UTC This earthquake was an aftershock of the September 2010 magnitude 7.0 earthquake, and one of hundreds of aftershocks Christchurch has experienced. However, unlike the September 2010 magnitude 7.0 earthquake, which struck early in the morning when streets were virtually empty, this earthquake struck just before 1 pm local time when the streets, shops and offices in Christchurch were full. In this image made from video run by New Zealand's TVNZ, cars crushed by rubble are seen following a strong earthquake in Christchurch, New Zealand Tuesday, Feb. 22, 2011. The strong, magnitude 6.3 earthquake rocked the southern New Zealand city of Christchurch on Tuesday, causing multiple deaths and damaging buildings throughout the city. AP Photo/TVNZ
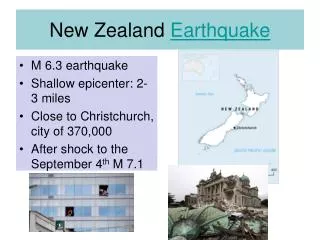
Magnitude 6.3 SOUTH ISLAND OF NEW ZEALANDMonday, February 21, 2011 at 23:51:43 UTC Christchurch was still rebuilding from the September 3, 2010 magnitude 7.0 earthquake that struck 45 km (30 miles) west of the city. That earthquake damaged hundreds of buildings in the city and caused an estimated $5 billion in damage. A strong aftershock in December further weakened buildings. The epicenter of the February 21, 2011 magnitude 6.3 earthquake was just 5 km (3 miles) from Christchurch. Because of proximity to the epicenter, ground shaking in Christchurch was much more severe for this latest earthquake than for the larger magnitude 7 event in September. Many Christchurch buildings were destroyed in this earthquake and entire suburbs were left unlivable. Rescuers reported people would remain trapped in buildings overnight. AP Photo/TVNZ
Magnitude 6.3 SOUTH ISLAND OF NEW ZEALANDMonday, February 21, 2011 at 23:51:43 UTC Ground Accelerations Google Earth™ mapping service Map showing measured Peak Ground Accelerations in the Christchurch area measured in percent g (gravity). - geonet.org.nz This earthquake had extremely unusual ground accelerations. Typically a magnitude 6.3 earthquake would cause ground acceleration of .25g (25 %g) at a distance of 10 km. However, in this earthquake the highest shaking was recorded at Pages Road Pumping Station at 188 %g, with a reading of 127 %g at Heathcote Valley Primary School. An acceleration over 100 %g is enough to cause any object not attached to the ground to be thrown in the air.
Magnitude 6.3 SOUTH ISLAND OF NEW ZEALANDMonday, February 21, 2011 at 23:51:43 UTC Regional Tectonics The South Island of New Zealand is cut by the Alpine fault that forms a transform boundary between the Pacific and Australian plates. There is no specific structure directly linking this event to the main fault of the September 2010 main shock, although there have been numerous aftershocks along generally east-west linear trends extending east from the end of the previous rupture. Modified from the New Zealand Herald
Magnitude 6.3 SOUTH ISLAND OF NEW ZEALANDMonday, February 21, 2011 at 23:51:43 UTC New Zealand is located at a point where the nature of the Pacific and Australian plate boundary changes in some rather fundamental ways. The subduction zone running down the East Coast of the North Island terminates off the Northeast coast of the South Island, about 100 km north of Christchurch, and gives way to a transform boundary cutting through the continental crust of the South Island, where the plate motions are accommodated by the largely right-lateral strike-slip faults of the Marlborough Fault Zone (MFZ in the figure above) and the Alpine Fault (AP). The north or north-east trends to the possible fault planes and the oblique thrust faulting mechanism may reflect an association with similarly-trending faults previously mapped in the Port Hills region, just to the south of Christchurch. Focal mechanism of February 21st earthquake, and it's location with respect to the plate boundary in New Zealand Source: Highly Allochthonous Blog – Chris Rowan
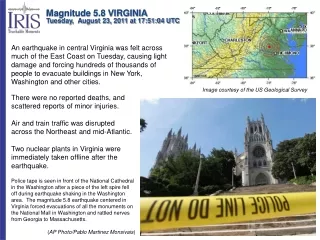
Magnitude 6.3 SOUTH ISLAND OF NEW ZEALANDMonday, February 21, 2011 at 23:51:43 UTC Earthquake and Historical Seismicity This earthquake (gold star), plotted with regional seismicity since 1990, occurred at the easternmost limit of the previous aftershocks of the September 2010 earthquake. Since the September 2010 main shock, there have been approximately 6 magnitude >= 5.0 aftershocks in the Christchurch region. The February 21st earthquake represents the largest aftershock to date. The February 21st earthquake has been followed by frequent aftershocks. Image courtesy of the US Geological Survey
Magnitude 6.3 SOUTH ISLAND OF NEW ZEALANDMonday, February 21, 2011 at 23:51:43 UTC Comparison of Sept 2010 and Feb 2011 Seismicity This earthquake (red star) with its aftershocks (orange dots), plotted with the September 2010 earthquake (red dot), occurred at the easternmost limit of the previous aftershocks of the September 2010 earthquake (yellow dots). Image courtesy of the US Geological Survey
Magnitude 6.3 SOUTH ISLAND OF NEW ZEALANDMonday, February 21, 2011 at 23:51:43 UTC Foreshocks and Aftershocks In a cluster, the earthquake with the largest magnitude is called the main shock; anything before it is a foreshock and anything after it is an aftershock. A main shock will be redefined as a foreshock if a subsequent event has a larger magnitude. Aftershock sequences follow predictable patterns as a group, although the individual earthquakes are themselves not predictable. The graph below shows how the number of aftershocks and the magnitude of aftershocks decay with increasing time since the main shock. The number of aftershocks also decreases with distance from the main shock. Aftershocks usually occur geographically near the main shock. The stress on the main shock's fault changes drastically during the main shock and that fault produces most of the aftershocks. Sometimes the change in stress caused by the main shock is great enough to trigger aftershocks on other, nearby faults. Image and text courtesy of the US Geological Survey
Magnitude 6.3 SOUTH ISLAND OF NEW ZEALANDMonday, February 21, 2011 at 23:51:43 UTC Mercalli Shaking Intensity Scale Shaking intensity scales were developed to standardize the measurements and ease comparison of different earthquakes. The Modified-Mercalli Intensity scale is a twelve-stage scale, numbered from I to XII. The lower numbers represent imperceptible shaking levels, XII represents total destruction. A value of IV indicates a level of shaking that is felt by most people. Perceived Shaking Extreme Violent Severe Very Strong Strong Moderate Light Weak Not Felt Modified Mercalli Intensity Image courtesy of the US Geological Survey USGS Estimated shaking Intensity from M6.3 Earthquake
Magnitude 6.3 SOUTH ISLAND OF NEW ZEALANDMonday, February 21, 2011 at 23:51:43 UTC USGS PAGER Population Exposed to Earthquake Shaking The magnitude 6.3 earthquake would have felt more powerful for many Christchurch residents than the original magnitude 7.0 earthquake in September 2010. This aftershock is significantly closer to the main population center of Christchurch than the September 2010 main shock and the hypocenter was shallow. Seismograph recordings show very high levels of shaking for this size earthquake. The color coded contour lines outline regions of MMI intensity. The total population exposure to a given MMI value is obtained by summing the population between the contour lines. The estimated population exposure to each MMI Intensity is shown in the table below. Image courtesy of the US Geological Survey
Magnitude 6.3 SOUTH ISLAND OF NEW ZEALANDMonday, February 21, 2011 at 23:51:43 UTC Google Earth™ mapping service 2004 Christchurch city council evaluation of liquefaction potential hazard. (red maps high liquefaction potential) Christchurch faces an additional hazard of liquefaction that can result from earth shaking during an earthquake, and which occurred in significant portions of the city in the September, 2010 earthquake. The effects of earthquake shaking on structures vary substantially across the City, depending on local differences in landforms, soils, and ground water levels. The most susceptible areas to liquefaction are those with water saturated, loose, well soiled silt, and sand. These materials under lay large parts of the eastern suburbs, much of that section of the city sits on unconsolidated quaternary sediments.
Magnitude 6.3 SOUTH ISLAND OF NEW ZEALANDMonday, February 21, 2011 at 23:51:43 UTC Liquefaction (where the solid ground takes on liquid qualities due to increased pressures) causes distortion of buildings and damage to buried cables, water and sewage pipes. Sand blows are characteristic evidence that liquefaction has occurred. Imagine a cube full of sand and water. If you press it in from both sides (compressing and releasing it, then compressing it again), you build up what’s called pore-water pressure,” said Martitia Tuttle, geologist and consultant for the U.S. Geological Survey. “It’s like shaking a coke can — when the pressure builds up and you release it, the fluid comes shooting to the surface.” Liquefaction occurs (and sand blows are formed) when the soft, sandy soil shakes forcing liquified sand to the surface causing heavy roads or whatever is on the surface to sink USGS Sand blow created during the M7.0 New Zealand Earthquake New Zealand Herald- Photo / Georgia Galloway