Download
1 / 22
220 likes | 361 Views
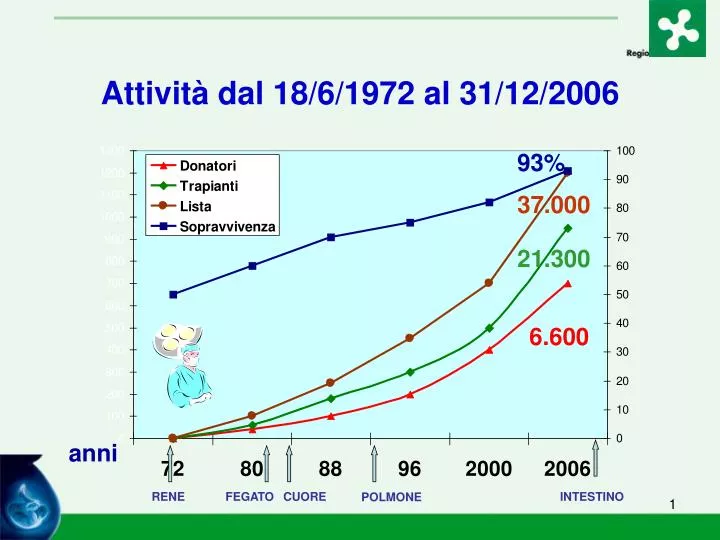
Attività dal 18/6/1972 al 31/12/2006. 93%. 37.000. 21.300. 6.600. anni. RENE. FEGATO. CUORE. INTESTINO. POLMONE. *Dati definitivi al 31 dicembre 2006. Dati NITp: età media donatori. FONTE DATI: Dati Reports CIR. Come si posiziona l’Italia in Europa?.

E N D
Attività dal 18/6/1972 al 31/12/2006 93% 37.000 21.300 6.600 anni RENE FEGATO CUORE INTESTINO POLMONE
*Dati definitivi al 31 dicembre 2006 Dati NITp: età media donatori FONTE DATI: Dati Reports CIR
Come si posiziona l’Italia in Europa? 2007donatori effettivi p.m.a. Donatori Spagna 35,1 Francia 22 ITALIA 21,0 19,2 Finland Norway 16,3 Sweden Estonia 21,1 Denmark 12,8 Latvia 13,9 Ireland Netherland Lithuania UK 14,9 13,8 12 24,4 Polonia 21,6 nel 2006 Germany Belgium 13,7 Luxemburg 18,6 CzechRepublic Slovakia 16,1 Switzerland Austria Moldavia Hungary 13,2 France Slovenia 8,9 Romania 18,3 11 Georgia Italy Portugal Spain 18,5 Croatia Bulgaria 33,8 Turkey 6,5 Greece Cyprus Dati CNT
*Dati preliminari al 30 novembre 2007 Donatori utilizzati ed effettivi– Anni 1992/2007* Donatori Effettivi – Utilizzati P.M.P. E F F E T T I V I E F F E T T I V I E F F E T T I V I E F F E T T I V I E F F E T T I V I E F F E T T I V I E F F E T T I V I 1197 1194 880 911 987 1.020 947 1042 1099 1203 1118 1141 1231 329 445 667 707 788 821 945 360 629 1120 576 ** Stima sulla base degli utilizzati del mese di agosto FONTE DATI: Dati Reports CIR
*Dati preliminari al 30 novembre 2007 Confronto Donatori Effettivi PMP 2006 vs 2007* Anno 2006 21, 6 Anno 2007* 21,0 FONTE DATI: Dati Reports CIR
*Dati preliminari al 30 giugno 2007 Attività donazione per regione – Anno 2007* % Opposizioni alla donazione Italia 31,5% FONTE DATI: Dati Reports CIR
*Dati preliminari al 30 novembre 2007 Totale Trapianti – Anni 1992/2007* Inclusi i trapianti combinati FONTE DATI: Dati Reports CIR
Sopravvivenza degli organi trapiantati per tipologia di trapianto (2000-2005)
*Dati preliminari al 30 novembre 2007 Trapianto di RENE – Anni 1992/2007* Inclusi i trapianti combinati FONTE DATI: Dati Reports CIR
9% 9% 10% 11% 11% 8% 12% 12% 11% 1% *Dati preliminari al 30 novembre 2007 Trapianti di FEGATO – Anni 1992/2007* Incluse tutte le combinazioni 11% Fegato Intero Fegato Split FONTE DATI: Dati Reports CIR
*Dati preliminari al 30 novembre 2007 Trapianti di CUORE – Anni 1992/2007* Inclusi i trapianti combinati FONTE DATI: Dati Reports CIR
*Dati preliminari al 30 novembre 2007 Trapianti di POLMONE – Anni 1992/2007* Incluse tutte le combinazioni FONTE DATI: Dati Reports CIR
*Dati SIT 9 dicembre 2007 Liste di Attesa al 31 ottobre 2007* Italia FONTE DATI: Dati Sistema Informativo Trapianti
*Dati SIT 9 dicembre 2007 Liste di Attesa al 31 ottobre 2007* Incluse tutte le combinazioni Rene Fegato Cuore Tempo medio di attesa dei pazienti in lista 3,01 anni 1,82 anni 2,51 anni 1,28 % 7,17 % 8,85 % % mortalità in lista FONTE DATI: Dati Sistema Informativo Trapianti
NITp. Trapianti effettuati Resoconto al 31 dicembre 2007 * FONTE DATI: Reports CIR
Donatori utilizzati nelle Regioni italiane 2006 (p.m.a.) Donatori Marche 32,6 Prov.Auton.Bolzano 32,4 Toscana 31,2 Friuli-Venezia Giulia 28,7 Emilia Romagna 28,6 Piemonte-Valle d’Aosta 28,4 Liguria 28,0 Veneto 25,8 Sardegna 22,1 Lombardia21,4 Lazio 17,0 Umbria 17,0 Abruzzo-Molise 15,8 Basilicata 11,7 Campania 11,6 Sicilia 11,3 Puglia 8,5 Prov.Auton.Trento 6,3 Calabria 4,5 ITALIA21,0 32,4 28,7 6,3 20,1 25,8 28,4 NITp = 24,2 28,6 AIRT = 24,2 28 OCST = 13,4 31,2 32,6 17 15,8 17 8,5 11,6 CNT 11,7 22,1 4,5 11,3
Aree Lombarde. Donatori utilizzati e organi procurati Attività di donazione nell’Area di Varese anno 2007. Donatori segnalati donatori utilizzati
Attività di prelievo multiorgano Ospedale Varese (1997 – 2007)
Trapianti di rene a Varese eseguiti dall’ottobre 1996 (n=438)
Anno 2007 – Liste d’attesa Prov. Varese
Prelievi e trapianti di cornee effettuati a Varese376 prelievi dal 1997 – 136 trapianti