Download
1 / 25
250 likes | 363 Views
The Impact of the Built Environment on Obesity and Activity in an Elderly Population. Ethan M. Berke, MD, MPH Department of Community and Family Medicine Dartmouth Medical School. Acknowledgements. Anne Vernez-Moudon, Dr. es Sc University of Washington Department of Urban Design and Planning

E N D
The Impact of the Built Environment on Obesity and Activity in an Elderly Population Ethan M. Berke, MD, MPH Department of Community and Family Medicine Dartmouth Medical School
Acknowledgements • Anne Vernez-Moudon, Dr. es Sc • University of Washington Department of Urban Design and Planning • Eric B. Larson, MD, MPH • Group Health Cooperative Center for Health Studies • Thomas D. Koepsell, MD, MPH • University of Washington Department of Epidemiology • Richard E. Hoskins, PhD, MPH • Washington State Department of Health • Phil Hurvitz, MFR • University of Washington Department of Urban Design and Planning
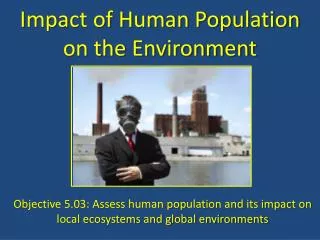
Background • Of population ≥ 65 y/o • > 40% overweight (BMI 25 - 29.9) • > 18% obese (BMI ≥ 30) • Obesity in the elderly • Increased CV disease • Diabetes • Depression • Physical activity provides many physical and psychological benefits
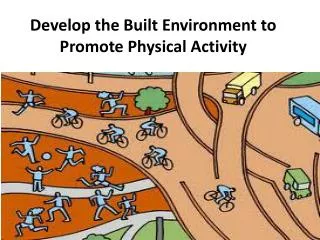
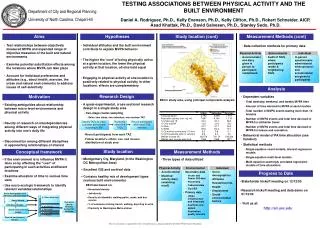
Research Question Are individuals 65 years of age and older living in areas of King County, WA, that are more walkable more active or less obese than elderly individuals living in areas that are less walkable?
Choose data to answer the question • Source of subject data • Geographic data from publicly available sources • Want data at individual-level • Avoid issues of ecologic fallacy and MAUP • Unique from census-based studies
Methods - Patient Population • Adult Changes in Thought (ACT) study • Group Health Cooperative study - 1994 - present • Prospective longitudinal design • ≥ 65 y/o • ~2500 subjects • Surveyed biennially • Information on BMI, self-reported walking • RxRisk, demographics, health conditions
Walkable & Bikable Communities Project • Custom extension in ArcView • Uses public data: • Tax parcel • Streets, blocks, sidewalks, bus routes • Land slope • Proximity analysis • Neighborhood clusters http://gis.washington.edu/phurvitz/wbc/
Walkable & Bikable Communities Project • Surface model application • Create smooth layer of walkability scores across study area • Geocode subjects at parcel level • Create buffers around each subject • Compute walkability score for each person at each buffer size
WBC Layers Residential Density Adapted from UW Urban Form Lab
WBC Layers Block Size Adapted from UW Urban Form Lab
WBC Layers Neighborhood Centers of Grocery, Restaurant, Retail Adapted from UW Urban Form Lab
Merging the Data WBC walkability score - Probability of walking > 150 minutes per week vs. none
Merging the Data Patient data from ACT study -BMI -Activity data -Health information -Address for geo-coding -Demographics WBC walkability score - Probability of walking > 150 minutes per week vs. none
Merging the Data Patient data from ACT study -BMI -Activity data -Health information -Address for geo-coding -Demographics Patient data from ACT study -BMI -Activity data -Address for geo-coding -Demographics WBC walkability score - Probability of walking > 150 minutes per week vs. none Geographic Information System (GIS) analysis of patient data overlaid on geographic data
Merging the Data Patient data from ACT study -BMI -Activity data -Health information -Address for geo-coding -Demographics Patient data from ACT study -BMI -Activity data -Address for geo-coding -Demographics WBC walkability score - Probability of walking > 150 minutes per week vs. none Geographic Information System (GIS) analysis of patient data overlaid on geographic data Statistical Analysis -Association of BMI, activity with walkability score
More walkable neighborhood Less walkable neighborhood
Results: Self-reported walking Analysis adjusted for CES-D score, income, education, arthritis, age, RxRisk score, living alone, and smoking
Results: BMI Analysis adjusted for CES-D score, income, education, arthritis, age, RxRisk score, living alone, and smoking
Neighborhood characteristics are associated with the frequency of walking for physical activity in older people. Whether this reduces obesity prevalence is less clear. Conclusion
Novel use of individual-level neighborhood data Objective measures of neighborhood Merge geographic and medical databases GIS Study Features