Download
1 / 1
10 likes | 119 Views
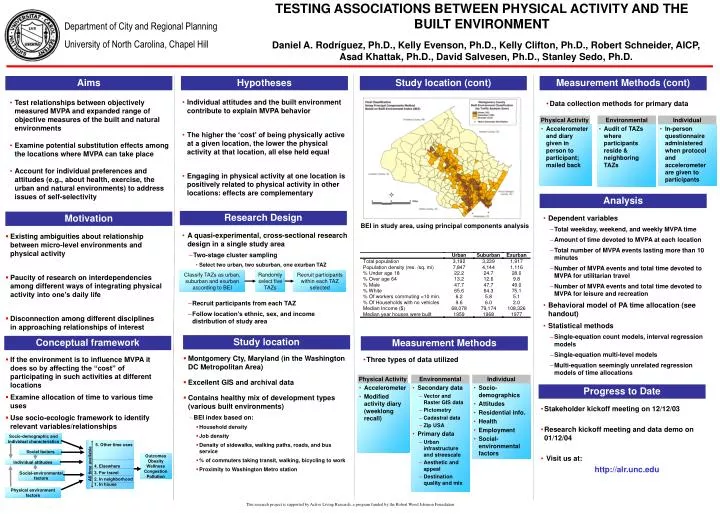
TESTING ASSOCIATIONS BETWEEN PHYSICAL ACTIVITY AND THE BUILT ENVIRONMENT. Classify TAZs as urban, suburban and exurban according to BEI. Randomly select five TAZs. Recruit participants within each TAZ selected. Socio-demographic and individual characteristics. 5. Other time uses.

E N D
TESTING ASSOCIATIONS BETWEEN PHYSICAL ACTIVITY AND THE BUILT ENVIRONMENT Classify TAZs as urban, suburban and exurban according to BEI Randomly select five TAZs Recruit participants within each TAZ selected Socio-demographic and individual characteristics 5. Other time uses Social factors Outcomes Obesity Wellness Congestion Pollution Individual attitudes All time available 4. Elsewhere 3. For travel Social-environmental factors 2. In neighborhood 1. In house Physical environment factors Department of City and Regional Planning University of North Carolina, Chapel Hill Daniel A. Rodríguez, Ph.D., Kelly Evenson, Ph.D., Kelly Clifton, Ph.D., Robert Schneider, AICP, Asad Khattak, Ph.D., David Salvesen, Ph.D., Stanley Sedo, Ph.D. Aims Hypotheses Study location (cont) Measurement Methods (cont) • Individual attitudes and the built environment contribute to explain MVPA behavior • The higher the ‘cost’ of being physically active at a given location, the lower the physical activity at that location, all else held equal • Engaging in physical activity at one location is positively related to physical activity in other locations: effects are complementary • Test relationships between objectively measured MVPA and expanded range of objective measures of the built and natural environments • Examine potential substitution effects among the locations where MVPA can take place • Account for individual preferences and attitudes (e.g., about health, exercise, the urban and natural environments) to address issues of self-selectivity • Data collection methods for primary data Physical Activity Environmental Individual • Accelerometer and diary given in person to participant; mailed back • Audit of TAZs where participants reside & neighboring TAZs • In-person questionnaire administered when protocol and accelerometer are given to participants Source: TransMilenio S.A. Analysis Research Design Motivation • Dependent variables • Total weekday, weekend, and weekly MVPA time • Amount of time devoted to MVPA at each location • Total number of MVPA events lasting more than 10 minutes • Number of MVPA events and total time devoted to MVPA for utilitarian travel • Number of MVPA events and total time devoted to MVPA for leisure and recreation • Behavioral model of PA time allocation (see handout) • Statistical methods • Single-equation count models, interval regression models • Single-equation multi-level models • Multi-equation seemingly unrelated regression models of time allocations BEI in study area, using principal components analysis • A quasi-experimental, cross-sectional research design in a single study area • Two-stage cluster sampling • Select two urban, two suburban, one exurban TAZ • Existing ambiguities about relationship between micro-level environments and physical activity • Paucity of research on interdependencies among different ways of integrating physical activity into one’s daily life • Disconnection among different disciplines in approaching relationships of interest • Recruit participants from each TAZ • Follow location’s ethnic, sex, and income distribution of study area Study location Conceptual framework Measurement Methods • Montgomery Cty, Maryland (in the Washington DC Metropolitan Area) • Excellent GIS and archival data • Contains healthy mix of development types (various built environments) • BEI index based on: • Household density • Job density • Density of sidewalks, walking paths, roads, and bus service • % of commuters taking transit, walking, bicycling to work • Proximity to Washington Metro station • If the environment is to influence MVPA it does so by affecting the “cost” of participating in such activities at different locations • Examine allocation of time to various time uses • Use socio-ecologic framework to identify relevant variables/relationships • Three types of data utilized Physical Activity Environmental Individual • Accelerometer • Modified activity diary (weeklong recall) • Secondary data • Vector and Raster GIS data • Pictometry • Cadastral data • Zip USA • Primary data • Urban infrastructure and streescale • Aesthetic and appeal • Destination quality and mix • Socio-demographics • Attitudes • Residential info. • Health • Employment • Social-environmental factors Progress to Date • Stakeholder kickoff meeting on 12/12/03 • Research kickoff meeting and data demo on 01/12/04 • Visit us at: http://alr.unc.edu This research project is supported by Active Living Research, a program funded by the Robert Wood Johnson Foundation