Download
1 / 11
110 likes | 118 Views
. b. a. . . Continuous Probability Distributions. The Uniform Distribution. The Normal Distribution. The Exponential Distribution. . . b. b. a. a. x 1. x 2. x 1. The Uniform Probability Distributions. . b. a. x 1. P(x 1 ≤ x ≤ x 2 ). P(x ≤ x 1 ).

E N D
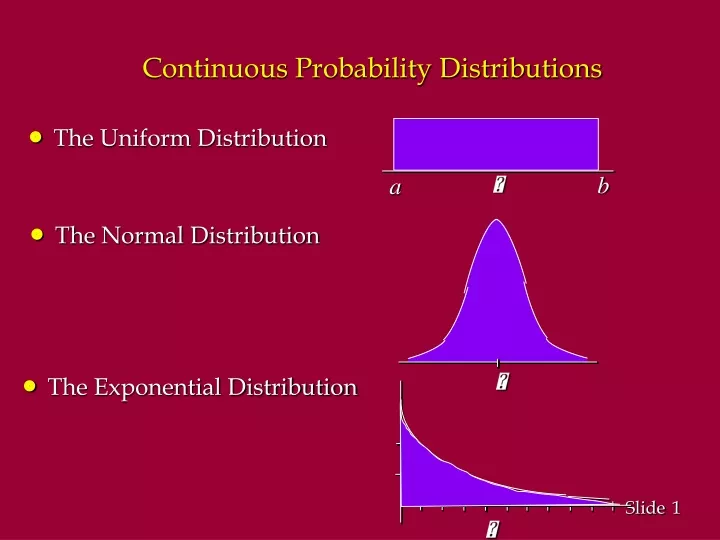
b a Continuous Probability Distributions • The Uniform Distribution • The Normal Distribution • The Exponential Distribution
b b a a x1 x2 x1 The Uniform Probability Distributions b a x1 P(x1≤x≤ x2) P(x≤ x1) P(x≥ x1)= 1- P(x<x1) P(x≥ x1)
The Uniform Probability Distribution • Uniform Probability Density Function f (x) = 1/(b - a) for a<x<b = 0 elsewhere where a = smallest value the variable can assume b = largest value the variable can assume The probability of the continuous random variable assuming a specific value is 0. P(x=x1) = 0
The Normal Probability Density Function where = mean = standard deviation = 3.14159 e = 2.71828
The Normal Probability Distribution • Graph of the Normal Probability Density Function f (x ) x
The Standard Normal Probability Density Function where = 0 = 1 = 3.14159 e = 2.71828
The table will give this probability Given positive z Given any positive value for z, the table will give us the following probability The probability that we find using the table is the probability of having a standard normal variable between 0 and the given positive z.
The Exponential Probability Distribution • Exponential Probability Density Function for x> 0, > 0 where = mean e = 2.71828 • Cumulative Exponential Distribution Function wherex0 = some specific value of x
Example The time between arrivals of cars at Al’s Carwash follows an exponential probability distribution with a mean time between arrivals of 3 minutes. Al would like to know the probability that the time between two successive arrivals will be 2 minutes or less. P(x< 2) = 1 - 2.71828-2/3 = 1 - .5134 = .4866
F (x ) .4 P(x< 2) = area = .4866 .3 .2 .1 x 1 2 3 4 5 6 7 8 9 10 Example: Al’s Carwash • Graph of the Probability Density Function