Download
1 / 19
190 likes | 195 Views
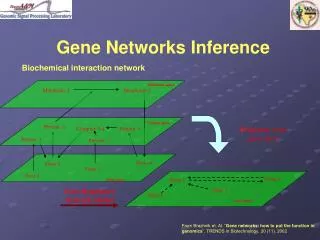
This article explores the structural inference of hierarchies in networks using a random graph model and consensus hierarchies. It also discusses edge and node annotation, as well as prediction of missing interactions in networks.

E N D
StructuralInferenceofHierarchiesinNetworks BYYuShuzhi 27,Mar2014
Content • 1.Background • 2.HierarchicalStructures • 3.RandomGraph Model of Hierarchical Organization • 4. Consensus Hierarchies • 5. Edge and Node Annotation • 6. Prediction of Missing Interactions in Network • 7. Testing • 8. Work to do
Background • Network and graph is a useful tool for analyzing complex systems. • Researchers try to develop new techniques and models for the analysis and interpretation of the network and graphs. • Hierarchy is an important property of real-world networks, since it can be observed in many networks.
Background • Previously, Hierarchical Clustering algorithms are used to analyze the hierarchical structure. • Choose a similarity measure method • Compute similarity for each pair of vertices(n×n matrix) • Identify groups of vertices with high similarity • Agglomerative algorithms (iteratively merged) • Divisive algorithms (iteratively split)
Background • Weakness of Traditional Hierarchical Clustering algorithms: • The algorithm only provides a single structure • It is unclear the result is unbiased.
Hierarchical Structure • Definition of Hierarchical Structure: • It is one that divides naturally into groups and these groups themselves divide into subgroups, and so on until reaching the level of individual vertices. • Representations: • Dendrogram or Trees • Example of dendrogram:leavesaregraphverticesandinternalverticesrepresenthierarchicalrelationships
RandomGraphModel • Assumption: • Theedgesofthegraphexistindependentlybutwithaprobabilitythatisnotidenticallydistributed.TheprobabilityisrepresentedasΘi. • HowtodetermineΘi: • Foradendrogram,usethemethodofmaximumlikelihoodtoestimate Θi. • Θi=E/(Li*Ri) • Ei:thenumberofedgesingraphthathavelowestcommonancestori(theinternalnode) • LiandRi:numberofleavesintheleft-andright-subtreerootedati. • Thelikelihoodforthedendrogramis: • LH(D, Θ)= Πi=1n-1(Θi)Ei(1– Θi)Li*Ri-Ei
RandomGraphModel • Howtofindthedendrogramwiththemaximumlikelihood: • Itisdifficulttomaximizetheresultinglikelihood. • EmployaMarkovChainMonteCarlo(MCMC)method. • Thenumberofdendrogramswithnleavesissuper-exponential:(2n-3)!!.However,inpracticetheMCMCprocessworksrelativelyquicklyfornetworksuptoafewthousandvertices.
RandomGraphModel • Markov Chain Monte Carlo sampling: • Let v denote the current state(adendrogram) of the Markov Chain. • EachinternalnodeIofthedendrogramisassociatedwiththreesubtress:twoareitschildrenandoneisitssibling.Therearethreeconfigurations. abcabcacb • Eachtimefortransition,chooseaninternalnoderandomlyandthenchooseoneofitstwoalternateconfigurationsuniformlyatrandom. For larger graphs, we can apply more dramaticallychangeofthestructure. • Weonlyacceptatransitionthatyieldsanincreaseinlikelihoodornochange:Lμ>=Lv;otherwise,acceptatransitionthatdecreasesthelikihoodwithprobabilityequaltotheratiooftherespectivestatelikelihoods: Lμ/Lv=elogLv-logLμ
RandomGraphModel • After a while, the Markov Chain generates dendrogramsμat equilibrium with probabilities proportional to Lμ.
ConsensusHierarchies • The idea is : • Instead of using one dendrogram to represent the hierarchical structure of the graph, we compute average features of the dendrogramsover the equilibrium distribution of models. • Method: • Takethecollectionofdendrogramsatequilibrium. • Derivesamajorityconsensusdendrogramcontainingonlythosehierarchicalfeaturesthathavemajorityweight. • Theweighthereisrepresentedbythelikelihoodofthedendrogram. • Result: • Theresultinghierarchicalstructuresisabettersummaryofthenetwork’sstructure. • Somecoarseningofthehierarchystructuresareremoved.
RandomGraphModel • Examples: Originaldendrogramconsensusdendrogram
NodeandEdgeAnnotation • Similartotheconceptofconsensus,wecanassignmajority-weightpropertiestonodesandedges. • Throughweightingeachdendrogramatequilibrium bylikelihood • For node, measure the average probability that a node belongs to its native group’ssubtree. • Foredge,measuretheaverageprobabilitythatanedgeexists. • Benefits: • Allowustoannotatethenetwork,highlightingthemostplausiblefeatures.
NodeandEdgeAnnotation • Example: Annotatedversion: Linethicknessforedgesproportionaltotheiraverageprobabilityofexistance Shapeindicatesgroup Shadedproportionaltothesampledweightoftheirnativegroupaffiliation(lighter,higherprobability)
PredictionofMissingInteractionsin Network • Hierarchical decomposition method: Find those highly possible connections but unconnected in real graph. These connections are probably missed. • Previous methods: • Assume that vertices are likely to be connected if • They have many common neighbors • There are short paths between them • They work well for strongly assortative networks, like citation and terrorist network. • Not good for disassortative network, like food webs.
PredictionofMissingInteractionsin Network • Hierarchical decomposition method works well for both assortative and disassortative networks.
Testing • Provided program: • fitHRG: • input a graph(edges list); • Output HierarchicalRandom Graph • ConsensusHRG: • input a dendrogram from fitHRG program • OutputHierarchicalRandom Graph • PredictHRG • Input a graph(edges list) • Output list of non-edges ranked by their model-averaged likelihood • Benchmark Test program provides: • Input a graph(edges list) • A list of nodes and their membership for the micro-communities • A list of nodes and their membership for the macro-communities
Work to do • Figure out how to convert dendrogram into group list • Improve the algorithm and compare
References • A. Clauset, C. Moore, and M.E.J. Newman. In E. M. Airoldi et al. (Eds.): ICML 2006 Ws, Lecture Notes in Computer Science4503, 1 - 13. Springer-Verlag, Berlin Heidelberg (2007). • A. Clauset, C. Moore, and M.E.J. Newman. Nature453, 98 - 101 (2008)