Download
1 / 14
140 likes | 156 Views
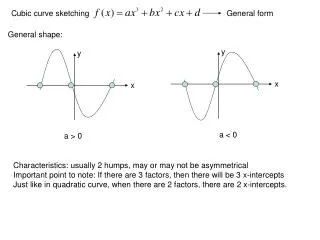
Curve sketching. This PowerPoint presentation shows the different stages involved in sketching the graph. Sketching the graph. Step 1: Find where the graph cuts the axes. When x = 0, y = 2, so the graph goes through the point (0, 2).

E N D
Curve sketching This PowerPoint presentation shows the different stages involved in sketching the graph
Sketching the graph Step 1: Find where the graph cuts the axes When x = 0, y = 2, so the graph goes through the point (0, 2). When y = 0, x = 2, so the graph goes through the point (2, 0).
Sketching the graph Step 2: Find the vertical asymptotes The denominator is zero when x = -2 The vertical asymptote is x = -2
Sketching the graph Step 2: Find the vertical asymptotes The denominator is zero when x = -2 The vertical asymptote is x = -2 For now, don’t worry about the behaviour of the graph near the asymptotes. You may not need this information.
Sketching the graph Step 3: Examine the behaviour as xtends to infinity For numerically large values of x, y→ -2. This means that y = -2 is a horizontal asymptote.
Sketching the graph Step 3: Examine the behaviour as xtends to infinity For numerically large values of x, y→ -2. This means that y = -2 is a horizontal asymptote.
Sketching the graph Step 3: Examine the behaviour as xtends to infinity For numerically large values of x, y→ -2. This means that y = -2 is a horizontal asymptote. For large positive values of x, y is slightly greater than -2. So as x→ ∞, y → -2 from above.
Sketching the graph Step 3: Examine the behaviour as x tends to infinity For numerically large values of x, y→ -2. This means that y = -2 is a horizontal asymptote. For large positive values of x, y is slightly greater than -2. So as x→ ∞, y → -2 from above.
Sketching the graph Step 3: Examine the behaviour as x tends to infinity For numerically large values of x, y→ -2. This means that y = -2 is a horizontal asymptote. For large negative values of x, y is slightly less than -2. So as x→ -∞, y → -2 from below.
Sketching the graph Step 3: Examine the behaviour as x tends to infinity For numerically large values of x, y→ -2. This means that y = -2 is a horizontal asymptote. For large negative values of x, y is slightly less than -2. So as x→ -∞, y → -2 from below.
Sketching the graph Step 4: Complete the sketch Since the graph only crosses the x axis at (2, 0), we can complete the part of the graph to the left of the asymptote.
Sketching the graph Step 4: Complete the sketch Since the graph only crosses the x axis at (2, 0), we can complete the part of the graph to the left of the asymptote.
Sketching the graph Step 4: Complete the sketch We can also complete the part of the graph to the right of the asymptote, using the points where the graph cuts the axes.
Sketching the graph Step 4: Complete the sketch We can also complete the part of the graph to the right of the asymptote, using the points where the graph cuts the axes. Notice that in fact we did not need to know whether the graph was above or below the horizontal asymptote for numerically large x. The sketch shows the only possibility!