Download
1 / 22
270 likes | 590 Views
4.3 Using Derivatives for Curve Sketching. Example. Use the first derivative test to find the local and absolute extreme values of:.

E N D
Example Use the first derivative test to find the local and absolute extreme values of:
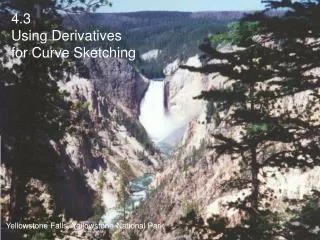
In the past, one of the important uses of derivatives was as an aid in curve sketching. Even though we usually use a calculator or computer to draw complicated graphs, it is still important to understand the relationships between derivatives and graphs.
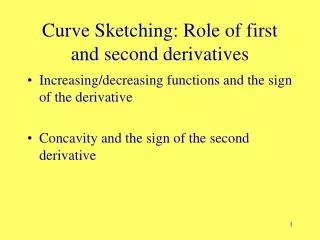
is positive is negative is zero is positive is negative is zero First derivative: Curve is rising. Curve is falling. Possible local maximum or minimum. Second derivative: Curve is concave up. Curve is concave down. Possible inflection point (where concavity changes).
There are roots at and . Possible extreme at . Set Example: Graph We can use a chart to organize our thoughts. First derivative test: negative positive positive
There are roots at and . Possible extreme at . Set maximum at minimum at Example: Graph First derivative test:
There is a local maximum at (0,4) because for all x in and for all x in (0,2) . There is a local minimum at (2,0) because for all x in (0,2) and for all x in . Example: Graph NOTE: On the AP Exam, it is not sufficient to simply draw the chart and write the answer. You must give a written explanation! First derivative test:
There are roots at and . Possible extreme at . Because the second derivative at x =0 is negative, the graph is concave down and therefore (0,4) is a local maximum. Because the second derivative at x =2 is positive, the graph is concave up and therefore (2,0) is a local minimum. Example: Graph Or you could use the second derivative test:
Possible inflection point at . There is an inflection point at x =1 because the second derivative changes from negative to positive. inflection point at Example: Graph We then look for inflection points by setting the second derivative equal to zero. negative positive
rising, concave down local max falling, inflection point local min rising, concave up Make a summary table: p
Example Determine the concavity and point of inflection of the curve y = 3 + sin x on [o, 2π].
Example Determine the concavity and point of inflection of the curve y = 3 + sin x on [o, 2π].
Example A particle is moving along a horizontal line with position function below. Find the velocity and acceleration and use this information to graph the function.
Example x(t) = 2t3 – 14t2 + 22t – 5, t ≥ 0
Example A function is continuous on its domain [-2, 4], f(-2) = 5, f(4) = 1, and f ' and f '' have the following properties: Sketch a graph of f:
- + - -2 2 4 0 + + - -2 2 4 0 Example A function is continuous on its domain [-2, 4], f(-2) = 5, f(4) = 1, and f ' and f '' have the following properties: