Download
1 / 20
200 likes | 207 Views
Assignment 1, due 9/5/19 Write a code for regression of nutritional rating vs sugar and fiber. Train with example from Cereals dataset on class web page Report bias and slopes for predictors sugar and fiber, coefficient of determination, R 2 , and standard error of estimation, s.

E N D
Assignment 1, due 9/5/19 Write a code for regression of nutritional rating vs sugar and fiber. Train with example from Cereals dataset on class web page Report bias and slopes for predictors sugar and fiber, coefficient of determination, R2, and standard error of estimation, s. Consider protein, fat, and sodium separately as a third attribute, in addition to sugar and fiber, to predict the nutritional rating cereals. Report the change in R2 and s relative to sugar and fiber only. Pullman students: Send your results to your TA at suraiya.akhter@wsu.edu
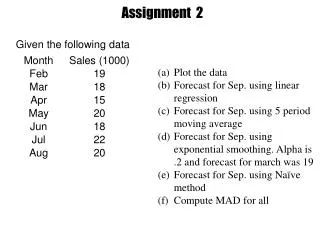
Assignment 2: Due 9/17/19 Classification by K Nearest Neighbors (KNN) technique Download and familiarize yourself with current version of Weka. Download and start the Weka GUI. Follow the instructions on the Weka site: http://www.cs.waikato.ac.nz/ml/weka/ We will only use the Weka’s Explorer functionality. There is much Weka documentation available. You may familiarize yourself with Explorer as much as you like by reading the user guide and using their provided sample datasets: Explorer guide
Can gene expression data predict the type of leukemia? Open the leukemia gene expression file (on class website) in Weka. This file has data from 72 leukemia patients (rows) and expression values are for 150 of their genes (columns). The last column is the type of leukemia (ALL or AML) for each patient. Go to the “classify” tab. Under “Classifier” click the “Choose” button. Expand the “lazy” menu and choose “IBk”. This is KNN. IBk stands for Instance-Based k.
Click on the text in the parameter box for IBk. A menu will pop up. For “KNN”, enter 5, which means the algorithm will use the five nearest neighbors to classify each data point. Leave the rest of the values as default. Under “Test options” choose “Cross-validation” and under “Folds” enter 5. The drop-down menu below Test options should say “(Nom) leukemia_type”. This means that the algorithm will classify “leukemia_type” (AML or ALL), using the gene expression values as attributes.
Click the “Start’ button. The main window will show a variety of summary statistics, such as accuracy, true positives, false positives, and a confusion matrix. Right click on the “Result list” on the left side of the screen. Choose “visualize threshold curve” and “ALL”. Record % correctly classified and confusion matrix (ALL positive class). Derive the confusion matrix when AML is the positive class. Calculate the class-dependent TP and FP rates. Show your work and compare to Weka. Capture the ROC curves for ALL positive and AML positive.
ZeroR is a baseline classifier that identifies the class with the most examples and predicts all examples to be in that class. Click the Choose button under Classifier, and expand the “rules” folder. Choose “ZeroR”. Again use cross-validation with Folds=5. Run it. Record % correctly classified and confusion matrix (ALL positive class). Derive the confusion matrix when AML is the positive class. Calculate the class-dependent TP and FP rates. Show your work and compare to Weka. Capture the ROC curves for ALL positive and AML positive. Any successful classification should yield more accurate results than ZeroR; however, if the number of examples of each class in the data set is greatly imbalanced, results with ZeroR will look good because most of the examples are correctly classified.
Assignment 3 due 9-24-19 Open the leukemia gene expression file (on class website) in Weka. Find the Naïve Bayes classification method. Use default values. Capture the Confusion Matrix assuming ALL is the positive class Construct the Confusion Matrix assuming AML is the positive class Calculate the class-dependent TP and FP rates. Show your work and compare to Weka. Compare with results from HW 2
Assignment 4: due 10-1-19 Use dataset randomized shortened glassdata.csv to develop a classifier for beer-bottle glass by perceptron regression. Keep the class labels as 1, 2, and 6. After fitting class labels as though they are a continuous response, bin the results to make predictions of class assignment. Default bin=2, Fit<1.5, bin=1, and Fit>4, bin=6 Report the following: Coefficient of determination, R2 number of records in each class and accuracy of class assignment overall accuracy 3-way confusion matrix as shown below # in class 1 assigned class 1 # in class 2 assigned class 1 # in class 6 assigned class 1 # in class 1 assigned class 2 # in class 2 assigned class 2 # in class 6 assigned class 2 # in class 1 assigned class 3 # in class 2 assigned class 6 # in class 6 assigned class 6
Assignment 5 part 1, Due 10-8-19 Find a linear discriminant that separates the patterns in the logicalOR dataset Choose w that points toward the (1,1) data point. Use [0,0.6] to calculate the bias. Find the equation of the decision boundary and draw it to the attribute-space diagram of the logical OR shown below. Calculate the margins of the open circle and closed circles patterns. Show all of your work. Logical OR p1 p2 t 0 0 0 0 1 1 1 0 1 1 1 1
Assignment 5 part 2, Due 10-8-19: Use PLA with specified initial weights and bias to find a weight vector and bias that separates the 2 points below in 3D attribute space. Assume the output of the perceptron is hardlim(wTp+b). Report the resulting weight vector, bias, and the equation of the decision boundary. Calculate the distances of the points from the decision boundary. Show all steps of the calculations.
Assignment 6 : logistic regression Due 10-15-19 • Start WEKA 3.8 and start the “Explorer window” • On the Preprocess tab, open the “logit-data.csv” file • Filter the data by clicking on “Choose” button -> filters -> unsupervised -> attribute -> NumericToNominal, then click “Apply” to generate a .arff file • Go to the “Classify” tab and click the “Choose” button. Choose “SimpleLogistic” classifiers under “functions”. • Run with default settings and 10-fold cross-validation. • Include the results summary and confusion matrix in your report • Return to the “Classify” tab and “Logistic” classifiers under “functions”. • Run with default settings and 10-fold cross-validation. • Include the results summary and confusion matrix in your report • The secret to the success of Simple Logistics may be its automatic attribute selection. In the output for Simple Logistics, find the attributes in the best case. Modify the excel file of logistic data to include only these attributes and rerun the Logistics case with default settings and 10-fold cross-validation. Include the results summary and confusion matrix in your report.
XOR in Gaussian feature space XOR data f1 = exp(-|X – [1,1]|2) f2 = exp(-|X – [0,0]|2) Xf1f2 (1,1) 1 0.1353 (0,1) 0.3678 0.3678 (0,0) 0.1353 1 (1,0) 0.3678 0.3678 HW7 part 1: Due 10/22/19 Decision boundary is f1+f2=0.94 Use wT=[1,1] to calculate bias and margins r=0 r=1
z2 z1 Features defined by on chosen weight vectors z1 = sigmoid(x1-x2-0.5) z2 = sigmoid(-x1+x2-0.5) Coordinates of features in the hidden layer x1 x2 arg1 z1 arg2 z2 r 0 0 -0.5 0.38 -0.5 0.38 0 0 1 -1.5 0.18 0.5 0.62 1 1 0 0.5 0.62 -1.5 0.18 1 1 1 -0.5 0.38 -0.5 0.38 0 HW7 part 2: Due 10/22/19 Find the bias and equation of the decision boundary with weight vector [1,1] and equal margins for both groups. Calculate margins to verify that they are equal.
Assignment 8 Due 10-29-19 Use Weka’s RBFnetwork to distinguish hand-written digits 1vs5. Load Weka’s RBFnetwork from package manager under Tools on the main menu. Use 1-5-1561-no name.csv for training. Use 1-5-424-no name.csv for testing. After loading the test set, select output predictions under more options. Choose CSV. Run with default settings. Save the results buffer that contains predictions of model on test-set examples. Edit to 2 columns, actual and predicted. Bin predications with a bin boundary of 3 separating examples classified as 1 and 5. Calculate the accuracy of predictions in each class, the overall accuracy, and the confusion matrix with column sums equal to class size.
Assignment 9 due 11-5-19 Part 1: Apply Weka’s Genetic Search in version 3.8 to find the best subset of attributes after 100 generations in the breast-cancer data on the class webpage when Naïve Bayes is used classify benign and malignant cases. Report fitness for chromosomes in the 100th generation and Weka’s list of the best tumor characteristics for classification. Report the accuracy of classification and confusion matrix when these tumor characteristics are used to classify the breast-cancer data.
Assignment 9 due 11-5-19 Part 2: Apply Weka’s InfoGain in version 3.8 to the rank leukemia gene expression dataset from HW1 by information gained. Report the top 5 genes. Use these 5 genes with Naïve Bayes to classify ALL and AML among cases in the dataset. Compare the accuracy using the top 5 genes to the accuracy using all the genes. Report the confusion matrix (ALL positive class) using the top 5 genes and compare to confusion matrix when all genes are used for Naïve Bayes classification.
Assignment 10 due 11-12-19 Calculate principal components of attributes in glass data short.csv on the class webpage. Do not include the 10th column, which class labels. Report the eigenvalues ranked by decreasing magnitude. Calculate PoV for all eigenvalues and plot.
Extra Credit Assignment: due last class before exam week Implement “online” training for regression on the class labels of the XOR dataset. Use MLP with one hidden layer that contains 3 nodes, bias, z1 and z2. Input layer contains 3 nodes x0=1 plus x1 and x2 for dataset. Transform the hidden nodes by sigmoid(wTx)=1/(1+exp(-wTx)) Initial weights: w1=[-0.5,1,-1], w2=[-0.5,-1,1], v=[24,-20,-20] Learning rate=0.001, no momentum parameter XOR dataset
Extra Credit Assignment continued Perform 1000 iterations with the example chosen randomly from the dataset. Before each weight update, calculate the sum of squared residuals and save for semilog plot of convergence. In addition to convergence plot, report the final weight vectors and predicted r value for each example in the dataset. With the final weights, calculate and report the values z1 and z2 for each example in the dataset.
Extra Credit Assignment continued Use the values of z1 and z2 associated with examples (0,0) and (0,1) and weight vector wT=[1,1] to calculate the bias of a decision boundary with equal margins for the 2 classes. Report the margins and include a plot of feature space with the decision boundary and location of features associated with the examples in the dataset.