Download

1 / 71
710 likes | 715 Views
Data Collection. Population Sampling. Literature review. Observation Background survey Broad area of research. Theoretical framework. Hypothesis generation. Variables clearly identified. Problem definition. Research design. Problem statement Research questions. Methods

E N D
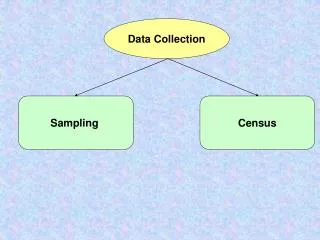
Data Collection Population Sampling
Literature review Observation Background survey Broad area of research Theoretical framework Hypothesis generation Variables clearly identified Problem definition Research design Problem statement Research questions Methods Data collection Analysis Interpretation Deduction Hypothesis substantiated? RQ answered? Where we are now…
Lesson objectives Review – sampling Collecting Quantitative data, Collecting Qualitative data
Population • A population consists of an entire set of objects, observations, or scores that have something in common. • Example: All males between the ages of 15 and 18. • Other examples ? • Your population?
Population and sample • A sample is a subset of a population • Not practical to study every member of the population, so we get “a sample” from the population • Sampling • Procedure by which some members of a given population are selected as representatives of the entire population
Parameters Numerical quantity measuring some aspect of the population Statistics Numerical quantity measuring some aspect of the sample Parameters and Statistics The distribution of a population can be described by several parameters such as the mean and standard deviation. Estimates of these parameters taken from a sample are called statistics. Quantitative
Parameters and statistics • Greek letters are used to designate parameters.. Parameters are rarely known and are usually estimated by statistics computed in samples. • Quantity Parameter Statistic • Mean μ M • Standard deviation σ s • Proportion π p • Correlation ρ r Quantitative
Definition of sampling terms • Sampling unit • Subject under observation on which information is collected • Sampling fraction • Ratio between the sample size and the population size • Sampling frame • Any list of all the sampling units in the population • Sampling scheme • Method of selecting sampling units from sampling frame Quantitative
What we need to know • Concepts • Representativeness • Sampling methods • Choice of the right design • Calculations • Sampling error • Design effect • Sample size Quantitative
Sampling and representativeness Target Population Sampling Population Sample Sampling Population Sample Target Population Quantitative
Inferential statistics • Inferential statistics • Used to draw inferences about a population from a sample • Inferential statistics require samples to be • Random • Representative Quantitative
Representativeness • Person • Demographic characteristics (age, sex…) • Exposure/susceptibility • Place (ex : urban vs. rural) • Time • Seasonality • Day of the week • Time of the day Ensure representativeness before starting, confirm once completed !!!!!! Quantitative
Sampling error • No sample is the exact mirror image of the population • Expressed by standard error • of mean, proportion, differences, etc • Function of • amount of variability in measuring factor of interest • sample size Quantitative
Methods used in probability samples • Simple random sampling • Systematic sampling • Stratified sampling • Cluster sampling • Multistage sampling Quantitative
Multiple stage sampling Principle • = consecutive samplings • example : sampling unit = household • 1rst stage : drawing areas or sections • 2nd stage : drawing buildings, houses • 3rd stage : drawing households Quantitative
Precision but no validity No precision Random error ! Systematicerror (Bias) ! Quality of an estimate Precision & validity
Select Participants: Choose a Sample Size • Select a sample size as large as possible from the individuals available • Select a sufficient number of participants for the statistical tests you will use • Calculate the sample size using a sample size formula Quantitative
Select Participants: Choose a Sample Size • A rough estimate: • 15 participants in each grp in an expt • 30 participants for a correlational study • 350 individuals for a survey study but depend of several factors Quantitative
Calculating sample size • Krejcie and Morgan (1970) Quantitative
EXAMPLE • Gender difference in vocational interest of post matriculation at UiTM • Independent variable: • Dependent variable: • Research Design: • Population: • Sample size: • Instrument:
Calculating sample size • Use web calculator • http://www.raosoft.com/samplesize.html • http://survey.pearsonncs.com/sample-calc.htm
When Does Sampling Occur? Before Data Collection After Data Collection has started What is the intent? What is the intent? To develop many perspectives To describe what is “typical” to those unfamiliar with the case To describe some sub-group in depth To take advantage of whatever case unfolds To explore confirming or disconfirming cases Maximal Variation Sampling Homogenous Sampling Typical Sampling Opportunistic Sampling Confirming/ Disconfirming Sampling To describe particularly troublesome or enlightening cases To generate a theory or concept To locate people or sites to study Theory or Concept Sampling Extreme Case Sampling Snowball Sampling Types of Purposeful Sampling
One may sample.. • Maximal variation • Most hardworking/ Highest achiever • Lowest achiever • Extreme case • ??
Examples of Non-Probability Samples • Convenience Sampling: participants are selected because they are willing and available to be studied • Snowball Sampling: the researcher asks participants to identify other participants to become members of the sample.
Non Probability sampling example • Study delinquent behaviour during recess. • I selected 1 school out of 4 - Interviewed all 4 principals and toured all 4 schools. I chose school to which I was given most access with fewest restrictions. Also school that reported the widest variations in delinquent behaviour during recess (very high to virtually no display). • Then sampled different locations with camera to find most varied activity and least self-conscious/guarded behavior. Where? • Turned out to be behind the surau. • Later used snowball approach in choosing children to interview.
Identify the variable Operationally define the variable Locate data (measures, observations, documents with questions and scales) Collect data on instruments yielding numeric scores Flow of Activities in Collecting Data
Identify Data Options: Specify Variables • Independent Variables • Dependent Variables • Intervening • Moderating
Identify Data Options: Operationalize Variables • Operational Definition: The specification of how the variable will be defined and measured • typically based on the literature • often found in reports under “definition of terms” • Sometimes the researcher must construct it
Identify the variable Operationally define the variable Locate data (measures, observations, documents with questions and scales) Collect data on instruments yielding numeric scores Self-efficacy for learning from others Level of confidence that an individual can learn something by being taught by others 13 items on a self-efficacy attitudinal scale from Bergin (1989) Scores of each item ranged from 0-10 with 10 being “completely confident.” Flow of Activities in Collecting Data Flow of Activities Example
Identify the variable Operationally define the variable Locate data (measures, observations, documents with questions and scales) Collect data on instruments yielding numeric scores Learning motivation of adult learners Interest and level of engagement of an individual ----- items on a questionnaire developed Scores of each item ranged from 1-5 with 5 being “most interested” Flow of Activities in Collecting Data Flow of Activities Example
Identify Data Options: Select Scales of Measurement • Nominal (Categorical): categories that describe traits or characteristics • participants can check • Female Male • Ordinal: participants rank the order of a characteristic, trait or attribute
Identify Data Options: Select Scales of Measurement • Interval: provides “continuous” response possibilities to questions with assumed equal distance ; scale with no true zero • Discrete (SD ---------------------SA) • Metric (oC) • Ratio: a scale with a true zero and equal distances among units
Practice Identify the level of measurement
Age Religion Gender Income bracket Test scores CGPA Frequency of asking questions Time spent on task Level of acceptance (0 – never, 5 – all the time) Activity ( 0 –not active, 5 – very active) Measurement level? Ratio ? Nominal? Ordinal? Interval?
Age Religion Gender Income bracket Test scores CGPA Frequency of asking questions Time spent on task Level of acceptance (0 – never, 5 – all the time) Activity ( 0 –not active, 5 – very active) Ratio Nominal Nominal Ordinal Ratio Ordinal Ratio Ratio Interval/ Ordinal Interval/Ordinal Measurement level?
Identify Data Options: Choose Types of Data Measures • An instrument is a tool for measuring, observing, or documenting quantitative data • Types of Instruments • Performance Measures (e.g. test performance) • Attitudinal Measures (measures feelings toward educational topics) • Behavioral Measures (observations of behavior) • Factual Measures (documents, records)
Record and Administer Data Collection: Locate or Develop an Instrument • Develop your own instrument • Locate an existing instrument • Modify an existing instrument
Record and Administer Data Collection: Locate or Develop an Instrument • Strategies to use • Look in published journal articles • Run an ERIC search and use the term “instruments” and the topic of the study • Go to ERIC web site for Evaluation and Assessment • Examine guides to commercially available tests
Obtain Reliable and Valid Data • Reliability: individual scores from an instrument should be nearly the same or stable on repeated administrations of the instrument • Bathroom scale
Reliability • Types of reliability • Test-retest (scores are stable over time) • Internal consistency (consistent scores across the instrument) • Cronbach coefficient alpha if items are scored as continuous variables (SA—SD) • Inter-rater reliability (similarity in observation of a behavior by two or more individuals)
Validity • Validity: the ability to draw meaningful and justifiable inferences from the scores about a sample or a population
Types of validity • Content (representative of all possible questions that could be asked) • Criterion-referenced (scores are a predictor of an outcome or criterion they are expected to predict • Construct (determination of the significance, meaning, purpose and use of the scores)
Let’ s look at a School Based Assessment Research The instrument