Download
1 / 37
370 likes | 495 Views
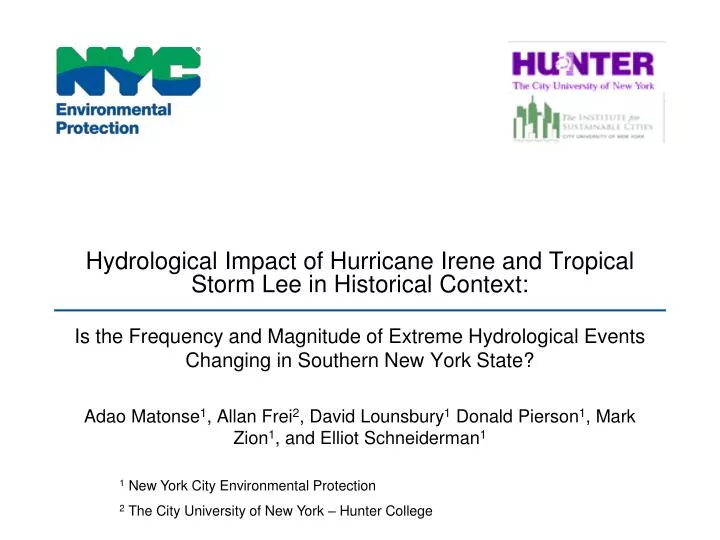
Hydrological Impact of Hurricane Irene and Tropical Storm Lee in Historical Context: . Is the Frequency and Magnitude of Extreme Hydrological Events Changing in Southern New York State?.

E N D
Hydrological Impact of Hurricane Irene and Tropical Storm Lee in Historical Context: Is the Frequency and Magnitude of Extreme Hydrological Events Changing in Southern New York State? Adao Matonse1, Allan Frei2, David Lounsbury1 Donald Pierson1, Mark Zion1, and Elliot Schneiderman1 1New York City Environmental Protection 2The City University of New York – Hunter College
Presentation Outline • Introduction • Study Area • Data and Methods • How Unique were Irene and Lee? • The Frequency of Extreme Events in the Study Region • The Magnitude of Extreme Events • Implications for Hydrology • Conclusions
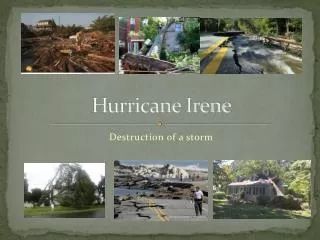
Irene in the Catskills Tannersville, photo by Sean Mahoney http://www.wnyc.org/blogs/wnyc-newsblog/2011/aug/31/focus-shifts-people-stranded-catskills-flood-waters-recede/ Main Street,Margaretville http://www.buzzfeed.com/mjs538/frightening-hurricane-irene-destruction-photos Windham http://www.buzzfeed.com/mjs538/frightening-hurricane-irene-destruction-photos New Windsor http://en.wikipedia.org/wiki/File:Forge_Hill_Road_bridge_washout_after_Hurricane_Irene,_New_Windsor,_NY.jpg
Irene in the Catskills: Schoharie Creek, Prattsville Photo Immediately after Irene, Sep 1, 2011, photo by Danyell Davis, NYCDEP
Changes over Time in Frequency of Extreme Events Warner Creek, Near Stony Clove, Catskills, May 2012 Headcut incised during storms of 2011 exposing glacial till that has probably not been exposed in 15-20K yrs. Course sediment is being recruited from upstream, but channel bed now at a lower base level than prior to Irene. These sorts of fluvial geomorphological changes are related to the frequency and magnitude of extreme events, as well as human impact on channel conditions. Human impacts up- or down-stream can also play a role. Photos and geomorphological information from Danyell Davis, NYCDEP
NYSERDA funded study : Hydrology, Vulnerability and Adaptation Implications of Hurricane Irene and Tropical Storm Lee:Case Study of the Mid-Hudson Valley and Greater Catskills Regions Hydrological study (this talk) Impacts, Costs, and vulnerabilities Adaptation and Needs Assessment
Collaborators NYCDEP: Don Pierson, Elliot Schneiderman, Mark Zion, Soni Pradhanang, Don Kent, Rajith Mukundan, Nihar Samal, Yongtai Hwang, David Lounsbury, Danyell Davis, Terry Spies, Dom Thongs, Jim Porter NYSERDA funded project on Hurricane Irene and Tropical Storm Lee: William Solecki, Simon Gruber, Robin Leichenko, Lesley Patrick, Susan Sofranko, Michael Brady
Study Area and Station Locations Map by David Lounsbury - NYCDEP
Data and Methods • Data • hourly-radar-based gridded daily 4km precipitation (NRCC) (DeGaetano and Wilks 2009) • 12 precipitation gauge records (NCDC) • >= 30 yrs continuous records • 9 stream gauge records (USGS) • >= 30 yrs continuous records, unregulated • Methods • Parametric (standard recurrence interval analysis) • non-parametric (define “extreme” as >=95th Percentile Event) • Seasonal (warm season = 1 June through 31 October) • Antecedent conditions (30 day precipitation prior to an extreme event) • Proximity in space and time of two extreme events
4-Day Precipitation Contours and Recurrence Intervals Hurricane Irene (26-29 Aug., 2011) Tropical Storm Lee (5-8 Sep. 2011) Maps by David Lounsbury, NYCDEP
Precipitation-Difference Contours and Stations Irene minus Lee Lee > Irene Irene > Lee Map by David Lounsbury, NYCDEP
Irene and Lee in context of historical extreme precipitation events • The events of Fall 2011 were unprecedented in this region due to a combination of • the magnitude of precipitation during Irene and Lee • the proximity of these two events • Antecedent conditions and subsequent precipitation • The occurrence of two events of comparable magnitude to Irene and Lee within only 11 days of each other is highly unusual in this region • 30-day total precipitation prior to Irene was large compared to other extreme events • If one considers all 60-day precipitation totals on record, the fall of 2011 stands out as an unprecedented event.
Percentage of Seasons During WhichExtreme 4-day Precipitation EventsOccur Within 12 days of each other(prior to Irene and Lee) Values are ranges across all stations.
Frequency of Extreme Events: Non-Parametric Analysis 5 highest values Example from one station Ellenville 4-day Precipitation 95 %tile value Cold Season Warm Season
Non-parametric data analysisExtreme Events (All Events >= 95 percentile) warmseason warmseason Unimodal (peak in Fall) Daily Precipitation Bimodal (peaks in Spring & Fall) Daily Streamflow
Changes over Time in Frequency of Extreme Events: Number of 95%tile values per year Example from Ellenville 4-day Precipitation max smooth value Smooth (11-yr mean) Cold Season Warm Season
Changes over Time in Frequency of Extreme Events Number of 95%tile 4-d precipitation values per year all stations Cold Season Warm Season max smooth value Smooth (11-yr mean) 1985, 2006
Changes over Time in Frequency of Extreme Events Number of 95%tile daily streamflow values per year all stations Cold Season Warm Season max smooth value Smooth (11-yr mean) 1985, 2006
Number of 95%tile values per year: all stations Cold season Warm season 4-day Precipitation 1-day Streamflow
Frequency analysis Daily Precipitation Warm > Cold(all events) Warm < Cold(for low return interval only) Daily Streamflow
Changes over Time in Magnitude of Flood Flows One example using multiple 30-year periods annual peak flow Each color is a different overlapping 30-year period starting 10 years apart
Other studies on extreme climatic events (EE) Showing increasing percentage CEI in recent years NOAA Climate Extremes Index (CEI) (= arithmetic average of six indicators) http://www.ncdc.noaa.gov/extremes/cei/graph/ne/cei/03-05 (accessed Sep 9, 2013)
… and projecting an increasing intensity of EE (Kunkel et al 2013, GRL)
Intergovernmental Panel on Climate Change Special Reports: SREX (2012) Climate Extreme (extreme weather or climate event): The occurrence of a value of a weather or climate variable above (or below) a threshold value near the upper (or lower) ends of the range of observed values of the variable.
Intergovernmental Panel on Climate Change Special Reports: SREX (2012) Projected decrease in recurrence intervals for daily precipitation equal to historical 20-year recurrence during the late 20th Century. Different colors = different scenarios
Implications for Hydrology • Of changing frequency and magnitude of extreme events • Bulletin 17B recommends 25-year record for flood frequency analysis • Based on assumption of stationarity of climate • Results show this assumption is questionable due to: • Trends • Hydrologic regime shifts (mean, variance) • Need for a “new normal” Shifts in mean Winter-flow USGS-1350000, 1929-2010
Nonstationarity or “changing normal” • Not new in water resources planning and management • Is usually considered when supported by a strong scientific basis (Hirsch 2011) • Basins urbanization lead to change in FF distributions • Groundwater depletion affecting baseflow and low flow regime • And these are not related to climate change
Nonstationarity • Can be reflected by various changes such as in: • Regional air temperature • Water demand as a function of temperature • Patterns of rain and snow • Timing of snowmelt • Frequency and magnitude of hydrologic extreme events • Land use/cover How does NYC address this issue ?
NYC Operations Support Tool • Simulates water supply by routing water between reservoirs, while accounting for various rules and competitive goals • Supports water supply operations and planning needs • High flexibility, improved inflow forecast
Conclusions • The events of Fall 2011 were unprecedented in this region due to a combination of: • the magnitude of precipitation in each event • the proximity in space and time of the two events • antecedent and subsequent precipitation • As a result, Fall 2011 had the highest 60-day precipitation total on record in this region
Conclusions (cont’d) • The frequencies of extreme warm season hydrologic events have risen to their highest values on record during the last two decades • While this study does not address potential for these patterns to continue into the future, these results are consistent with other recent empirical studies, and with 21st century projections based on climate models
Conclusions (cont’d) • Nonstationarity is a concern in hydrology and needs to be addressed • It need to be accounted for in water resources planning and management • The NYC OST is a good example for a flexible management tool to face today’s challenges
Thank You! Deep gorge created in Frost Valley (Ulster County Route 47) when floods after Hurricane Irene blew out a culvert below the road in Oliverea, NY. http://en.wikipedia.org/wiki/Effects_of_Hurricane_Irene_in_New_York#Orange_County
Number of 95%tile values per year: all stations Cold season Warm season 30-day Precipitation 30-day Streamflow
Number of 95%tile values per year: all stations Cold season Warm season 60-day Precipitation 60-day Streamflow
Extreme Events Can Affect Water Quality Ashokan reservoir during a turbidity event. Turbid water moving from West to East basins (2006)