Download
1 / 30
340 likes | 585 Views
SLOSH. S ea, L ake, and O verland S urges from H urricanes. Part 1: W. Shaffer / MDL Part 2: B. Jarvinen / NHC. DEFINITIONS:. STORM SURGE is the increase in water level due to a storm (hurricane / tropical storm / high winds). STORM TIDE is the total water level during a storm

E N D
SLOSH • Sea, • Lake, and • Overland • Surges from • Hurricanes Part 1: W. Shaffer / MDL Part 2: B. Jarvinen / NHC
DEFINITIONS: STORM SURGEis the increase in water level due to a storm (hurricane / tropical storm / high winds). STORM TIDEis the total water level during a storm = Astro Tide + STORM SURGE + Rainfall Runoff + Anomaly
b Storm tide 8.1 ft
Storm tide 8.1 ft Predicted Tide 0.9 ft
Storm tide 8.1 ft Storm Surge = Storm Tide – Predicted tide Predicted Tide 0.9 ft
Storm tide 8.1 ft Storm Surge = Storm Tide – Predicted tide = 8.1 – 0.9 = 7.2 ft Predicted Tide 0.9 ft
SLOSH Hurricane Storm Surge Model • Solves shallow water equations • Orthogonal curvilinear grid system • 2-dimensional (2 ½ dimensional ???)
SLOSH Hurricane Storm Surge Model • Overland flooding • Sub-grid Features: • 1-dimensional flow for rivers and streams • barriers • cuts between barriers • channel flow, with chokes and expansions • Increased friction for trees and mangroves
Individual Grid Barrier Stair Step Rise Water Surface above a square Transport Points Water Depth above a square Surge Points DATUM Dry and wetted grid squares. The squares are two-dimensional stair steps.
Topo/BathyData Sources USGS LSU NGDC
SLOSH Hurricane Storm Surge Model • Embedded parametric hurricane wind model • Uses a normalized wind profile • Solves diff eqn for wind speed and direction (Direction is NOT specified a priori) • Uses pressure, not observed wind speed • Forward speed incorporated into asymmetry
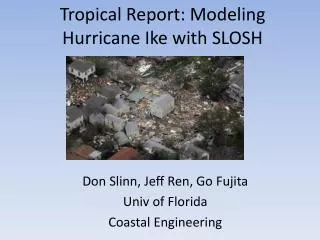
SLOSH Hurricane Storm Surge Model • Universal, not “calibrated” to location • Utilizes “forecastable” hurricane parameters • Tested on MANY past hurricanes
INPUT TO SLOSH TRACK Positions - latitude & longitude INTENSITY - (pressure drop) SIZE - Radius of maximum wind
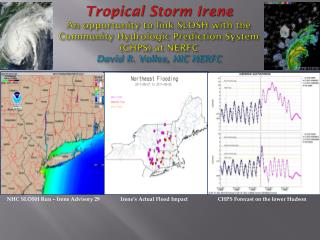
SLOSH Hurricane Storm Surge Model • Designed for hurricane evacuation planning • Used as input to hydrology’s DWOPER river model – forecast hydrograph at selected locations used to initialize wave which propagates up river • Being used for real-time surge forecasting near landfall time (beginning 24 hours before projected landfall)
SLOSH Hurricane Storm Surge Model • Model output: • MOM’s and MEOW’s • Individual runs – in real time • Historical hurricane runs • Probabilistic surge forecasts • Available in • SLOSH display format • GIS format (ArcView or MapInfo) • Animations (on web)
SLOSH Hurricane Storm Surge Model • Not included currently: • explicit tide computation • wave setup and runup