Download
1 / 21
210 likes | 289 Views
Lake Chesdin VWP Permit 2012. Proposed permit operational rules and analysis of cumulative impacts to beneficial uses. Elements of Analysis. Projected Demands Safe Yield / days of storage remaining Impact on Beneficial Uses Water Supply Downstream aquatic life (IFIM) On-lake aquatic life

E N D
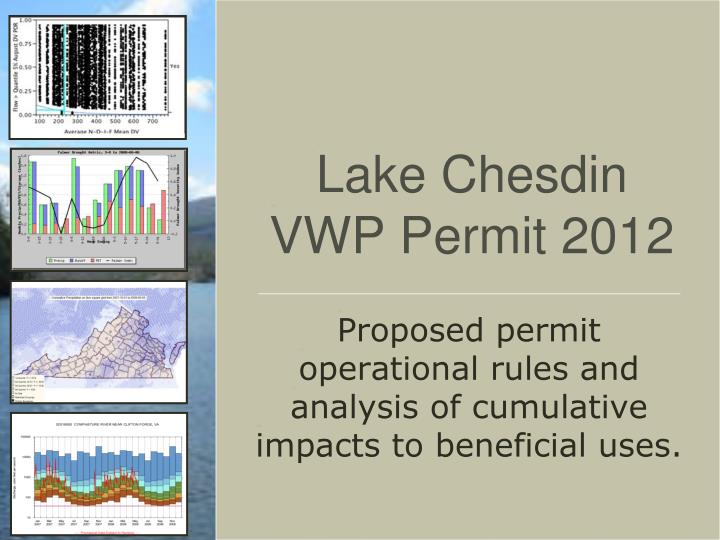
Lake Chesdin VWP Permit 2012 Proposed permit operational rules and analysis of cumulative impacts to beneficial uses.
Elements of Analysis • Projected Demands • Safe Yield / days of storage remaining • Impact on Beneficial Uses • Water Supply • Downstream aquatic life (IFIM) • On-lake aquatic life • On-lake recreation • Downstream water quality • Downstream water supply
Water Budget: Permitting Period Demands • Historical Maximum monthly withdrawal rate of 47 MGD in 2010 • JPA Requests maximum monthly withdrawal of 62 MGD in 2030 • 15 MGD = 0.23 inches/day or 7.5 inches per month • Summer-time use ~ 52 MGDprojected in 2030 Figure 2: Withdrawal trends in Lake Chesdin from 2000-2012.
Water Budget: Gage Inflow Statistics Figure 9: Approximate water level loss, summer evap. & 40 MGD withdrawal. • 40 MGD use ~ 0.6 in / day • Summer evap. rate ~ 0.15 in/day • Monthly Patterns: • July is when the biggest drop in inflows occurs • August is when the lowest single day flows occur • September is when the lowest average monthly flows occur • Recent inflows (2000-2011) are much lower than historical values (Table 1) Table 1: Comparison of inflows between period 1946-2012 and 2000-2012.
Climatic Trends: Wet & Dry Periods Figure 4: Linear regression showing trends in minimum annual inflow to Lake Chesdin since 1947. • Simulations were run for “dry” (2000-2012)& “normal” (1947-2012) • Recent meteorological patterns suggest a pattern of more signif-icant droughts • It is not clear if this is simply a short-term trend or “the new normal” • Dry periods result in more frequent draw-downs, drought restrictions and reduced in-stream flows.
Beneficial Use Analysis • Predictive modeling of reservoir release rules. • IFIM study of downstream aquatic habitat (for Juv. Shad, E. Complenata, Smallmouth Bass and the Deep-Fast, Deep-Slow, Shallow-Fast, and Shallow-Slow guilds) • Modeling of lake-levels: • impacts to public water supply, • on-lake recreation, and freedom of movement for migratory species. • Monitoring of resident species populations and an analysis of the impact of lake-level fluctuations on them. • Consult with DEQ staff re: the James River Chlorophyll A TMDL & water quality in Appomattox near tidal-fresh James River. • Consulted with DEQ Piedmont Regional Office regarding the South Central Wastewater Treatment plant discharge.
Goals for Reservoir Management Meet the projected water supply needs of 52.3 MGD during the critical 180 day draw-down period, and 60 days minimum storage during the drought of record. Minimize loss of downstream habitat (0-20% during normal-high flow conditions and 0-10% during drought). Minimize long-term (>45 days) closure of fish out-migration, eliminate post October 15th. Minimize draw-down >2 feet during summer months to preserve on-lake recreation. Maintain safe-yield (the original 55 MGD).
IFIM Overview • Regulated flows from 60-250 cfs • >10% habitat loss shown to result in negative impacts Figure 3: Size and Catch Per Unit Effort of largemouth bass as a function of previous year drawdown in Lake Chesdin. Analysis of downstream habitat based on flows and field surveys
On-Lake: DGIF On-Lake Biota and Drawdown in Lake Chesdin Figure 4: Size and Catch Per Unit Effort of largemouth bass as a function of previous year drawdown in Lake Chesdin. Littoral species inhabit shallow water areas that change with low lake levels. In Chesdin, these are primarily sunfish species (largemouth bass and bluegill) DGIF data since 1986, intensively since 2000 Biologists conclude that drawdown has little to no effect on these littoral species (Fig. 5).
Proposed Permit Rules Basic Permit Rules Maximum Release (Qmax*)
Likelihood of Summertime Drought Flows - R25 Figure 5: Probability of a summertime flow less than the 25% “non-exceedence” level based on flow November-February. • Probability of < 25% flow based on winter recharge • Used to reduce max release, • < drawdown • > storm capture • 2002 = 54% • 2003 = 24% • 2012 = 48%
Permit Effects: Downstream Shad Figure 6: Median Juvenile shad habitat for pre-dam, current permit & draft permit rules. Median habitat Current Permit shows 1-5% loss in June, October, ~ 0% loss in other months Proposed rules limit additional losses to < 8% in all months
Permit Effects: Downstream Deep Fast Guild Figure 7: Median Juvenile shad habitat for pre-dam, current permit & draft permit rules. Current Permit shows 15% loss in June, October, <5% loss in other months (including some slight gains) Proposed 13-20% in June-November
Permit Effects: Downstream Shallow Fast Guild Figure 8: Median Shallow-Fast habitat for pre-dam, current permit & draft permit rules. Current Permit shows 15% loss in June, October, <5% loss in other months Proposed 25-35% in Jun-Aug, and Oct. & 17-18% in Sep. and Nov.
On-Lake Recreational Area Table 2: Estimated amount of lake area with water > 3 feet deep at various levels of drawdown. • Boating Area available considered to be water > 3 feet deep. • Dock Access: • “Based on feedback from Chesterfield County and Dinwiddie County … a lake level of 3 to 4 feet below normal pool is … where dock access is significantly impaired. “ (IFIM, 2012) • Certain areas of lake have impaired dock access at ~18” drawdown (Chesdin Landing).
Permit Effects: On-Lake Recreational Area Figure 10: Number of years with draw-downs > 2 ft by month for June-September. Summer months (June-September) with at least 1 day drawn down > 2 ft (<20% loss of rec area) Dry period > 50% decrease Jun-Jul, 10-20% Aug-Sep Full period > 60% decrease Jun-Jul, 30-40% Aug-Sep
Permit Effects: On-Lake Recreational Area Figure 11: Number of years with draw-downs > 1 ft by month for June-September. Summer months (June-September) with at least 1 day drawn down > 1 ft (<11% loss of rec area) Dry period > 25% decrease Jun&Aug, <10% Jul&Sep Full period > 40% decrease Jun-Jul, 15-20% Aug-Sep
Impacts of Dam Raising • Minimal effects on relative draw-down (i.e. -1 ft) • Substantial effects on absolute draw-down (i.e. feet above sea level) • Increases total recreational area • Decreases incidence of dry-docks • Increase “safe-yield” of reservoir for water supply • 1.5’ rise increases safe yield to ~ 63 MGD (+10 MGD) • Inundation study, necessary • Wetlands impacts • Flood impacts • Guide Curve approach to management useful • Sedimentation may reduce gains made by dam raising over a 25-50 years period.
Additional Permit Info • These are Proposed Permit Rules • A storage management plan is required for this permit issuance. • Sedimentation plan • There will be a provision to monitor & report on procurement of future storage/source acquisition • Demand increases over time • Loss of storage due to sedimentation • Plans for meeting future need. • Potential for provisions that address operations under increased dam level in this permit
Next Steps • Provide draft permit to ARWA. • Address any comments they have. • Initiate public notice. • Depending on comments: • Issue permit, or • Public hearing -> State Water Control Board
Common Statistical Measures of Impact • Median – the value which marks the 50% line. For example, if we say: • Median July release is 120 cfs = 50% of release flows are less than 120 cfs during July • Median July drawdown is 1.5 feet = lake is drawn down more than 1.5 feet half of the time • 10th %ile– the lowest 10% of occurrences. For example: • 10th %ile August Inflow is 120 cfs = 90% of the time, inflows during August are greater than 120 cfs • 10th %ile flow is considered drought warning status in Virginia state plan • Median may be thought of as “chronic”, whereas 10th %ile may be thought of as “acute”