Download
1 / 22
220 likes | 327 Views
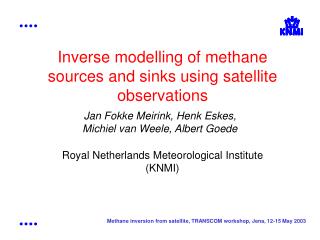
Inverse emission estimates for Europe using tall tower observations and the COMET inverse model. Alex Vermeulen 1 , Gerben Pieterse 1,2. 1: ECN 2: IMAU . ECN and Cabauw observations. Cabauw – CBW – The Netherlands (ECN). Height: 200m AGL Base: -2m ASL Lon: 04°56’ Lat: 51°58’

E N D
Inverse emission estimates for Europe using tall tower observations and the COMET inverse model Alex Vermeulen1, Gerben Pieterse1,2 1: ECN 2: IMAU
Cabauw – CBW – The Netherlands (ECN) Height: 200m AGL Base: -2m ASL Lon: 04°56’ Lat: 51°58’ Levels: 20m, 60m, 120m, 200m LU: Grassland, crops 3
Flux and concentration vertical gradients Cabauw Casso-Torralba et al, 2007 (in prep) 5
Measurements, Modelling, SRM’s and Inversion • Independent verification of bottom up estimates: UNFCCC, process models • It seems so easy: Subtract the influence of meteorology on the concentration, what remains is the influence of emissions • BUT: the atmosphere is a very efficient mixer, most of the signal is lost in 1-2 days of travel • SO: measure close to the sources at high temporal resolution, extend in the mixed layer to reduce the very local influence • Current global network not sufficient • Not many stations, but high frequency measurements and lots of noise in atmosphere and models • Mathematically: Ill posed problem, we need constraints 6
The COMET model • Trajectory model, offline meteorology • COMET model, 0.5o windfields, Flextra trajectories • ECMWF meteorology, MLH Crit. Richardson scheme • CH4 fluxes from METDAT (Berdowski et al, 1998): 3-hourly time-res. at 10’ horiz. resolution • Mixed layer bulk concentration • Hourly 144-hr backward trajectories • CH4 meas vs. model: • R2=0.84 during summer, bias=0 ppb, RMSE=115 ppb (6%) • Full year: R2=0.72 Vermeulen et al, ACPD, 8727, 2006 7
Modeling framework at ECN SRM Calculations COMET model (FLEXTRA1) Forward Calculations Trajectory data Concentrations Spatial Aggregation LPDM model (FLEXPART1) LPDM data Synthetic data Inverse Calculations dXk=Cklel Concentration enhancements Inventory data Concentration data (Co) Variance Optimization Flux model Flux data? Recursive Spatial Aggregation Deposition fluxes Concentrations Fluxes 1 Stohl, A. (1998): Computation, accuracy and applications of trajectories - a review and bibliography,Atm. Env., 32, 947-966 8
Diurnal variation get lost after 24 hours… Model: COMET; Background CO2 levels from TM5 (Krol, pers comm). 9
COMET model forward results: Mixed layer concentrations CO2 for 2002 CBW HUN 10
The source aggregation scheme for SVD inversion • Calculate Source-receptor relationship (SRM) per hour and per observation point at high resolution of 10’ (~10 km) or multiple of this • Run transport model to determine maximum annual average SRM value ppm/(kg/(m2.s)) or potential contribution (SRM*E) in ppm • Aggregate neighbouring areas by joining until sum of area >= maximum contrib: SRM shrinks from 200*400 to ~200 rows=regions • Rerun transport model to build SRM for aggregated regions • Iteratively perform SVD and aggregate adjacent areas with high covariance in emissions (dipole) against observations • Iteratively remove areas with resulting emission of high variance (e.g. >30%) from SRM • Until stable number of regions or no regions left… • Procedure retrieves the maximal spatial resolution that can be resolved from the combination of model and measurements. Modification for (partial) resolving emissions of source categories, temporal patterns or any combination of these is relatively easy 12
Results: CBW station only • Cabauw measurements 2006 • 25 areas can be resolved • Fluxes in kg(CH4).km-2.s-1 • Areas 24 is United Kingdom, 25 N-Germany, 1-8 are Netherlands Synthetic inversion: Forward modelled Concentration is input for inversion Posterior+s.d. Prior 200 km 15
Results for CBW single years: 2002 Prior Post 2002 16
Inverse determined annual emissions for The Netherlands Uncertainty: 20-30% 18
Inverse calculations for methane at multiple sites for 2002 Emission [mg m-2 min-1] Region index 20
Conclusions & Outlook • Emissions (of methane) can be constrained from atmospheric signal without a priori information on their size • Atmospheric inversion of area of big emissions needs high resolution in space and time, 10’ and hourly or better: otherwise degradation of signal • Source Aggregation+SVD form robust combination • Systematic model errors still problematic: need to get the models right, minimise bias: background concentration, MLH • CBW CH4 concentration data constrains emissions of an area 400x400 km2 • Multiple years extend the constrained area • Multiple stations extend the area as well (of course) • Tall tower data very valuable provided continuous vertical gradients are measured at high frequency • By 2007 and further 6 tall towers will provide 2006 data for CH4, N2O, SF6 and CO2 21
Acknowledgements • Climate Changes spatial planning/Klimaat voor ruimte Research Program • EU FP5: CHIOTTO, contract EVK2-2002-0163 • National funding agencies: • VROM • Senter/NOVEM • The Transcom continuous experiment: http://www.purdue.edu/transcom/protocol_v5.pdf • Maarten Krol (IMAU,WuR) for background CO2 data from TM5 • Sander Houweling (IMAU) for background CH4 data from TM3 • Pim van den Bulk • Piet en Mike Jongejan • Han Mols 22