Download
1 / 5
50 likes | 120 Views
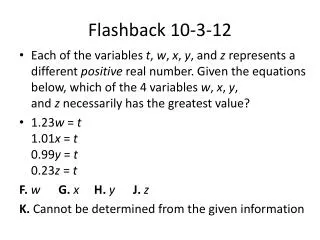
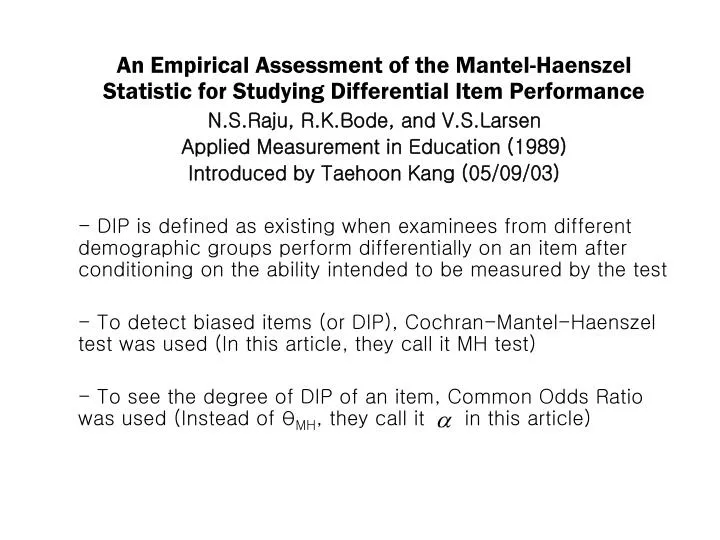
An Empirical Assessment of the Mantel-Haenszel Statistic for Studying Differential Item Performance N.S.Raju, R.K.Bode, and V.S.Larsen Applied Measurement in Education (1989) Introduced by Taehoon Kang (05/09/03)

E N D
An Empirical Assessment of the Mantel-Haenszel Statistic for Studying Differential Item Performance N.S.Raju, R.K.Bode, and V.S.Larsen Applied Measurement in Education (1989) Introduced by Taehoon Kang (05/09/03) - DIP is defined as existing when examinees from different demographic groups perform differentially on an item after conditioning on the ability intended to be measured by the test - To detect biased items (or DIP), Cochran-Mantel-Haenszel test was used (In this article, they call it MH test) - To see the degree of DIP of an item, Common Odds Ratio was used (Instead of θMH, they call it in this article)
X: demographic group membership (0=reference group, 1=focal group) Y: item score (0=incorrect, 1=correct) Z: test score group (by dividing the test scores into categories which number is K) - The null hypothesis that X and Y are conditionally independent given Z, means that the conditional odds ratio θXY(k) between X and Y equals 1 in each partial table. - If the null hypothesis for an item is rejected by the CMH test, we can conclude the item is biased. And the Common Odds Ratio is obtained to see the extent of the bias. Table (X, Y, and Z variables)
The purpose of this article- it is to provide an empirical evaluation of the MH technique to detect biased items in an achievement test. - This empirical study was carried out (1) to determine the effects of the number of score groups, and (2) to see the effect of the inclusion or exclusion of the studied item in forming score groups Data- The 40 items vocabulary test from the Survey of Basic Skills (SBS), The item response data for this study came from a sample of 3,795 fourth, fifth, and sixth graders who took the vocabulary test as part of the SBS standardization (2,400 White, 1,161 Black, and 234 Hispanic examinees)
Analysis - For each racial comparison (W vs. B, and W vs. H), 10 different DIP analyses were performed with the MH technique to assess of the number of score groups and the inclusion or exclusion of the studied item * Total raw test score used to get K groups (K=2, 4, 6, 8, or 10)
Results- About the effect of the number of score groups, they concluded that we can have stable MH test results when the group number is equal to or bigger than 4 - Also, as the number score groups increase, both the inclusion and exclusion of a studied item resulted in approximately the same number of biased items. - Finally, when there are 40 multiple choice items scored 0 or 1, we need to have more than 4 score groups to find DIP items in a stable wayCritique- The problem of the MH technique used in this article is that there is no test to check homogeneous association. In other words, when we reject the hypothesis of conditional independence using CMH test for an item, we don’t know such association is homogeneous or not over all the partial tables. In this article, however, they just got the θMH without checking the homogeneous association. Then, I think we need to apply Breslow-Day statistic to DIP study