Download
1 / 15
150 likes | 272 Views
Continuous measurements of CO 2 emission from cultivated peat soil . effect of tillage intensity. Örjan Berglund & Kerstin Berglund Department of Soil and Environment, SLU Sweden. Long term field trial (R2-4014). Gotland, Sweden. D-. Treatments. A Ploughing every year

E N D
Continuous measurements of CO2 emission from cultivated peat soil effect of tillage intensity Örjan Berglund & Kerstin Berglund Department of Soil and Environment, SLUSweden
Long term field trial (R2-4014) Gotland, Sweden
Treatments A Ploughing every year B Ploughing 1 out of 4 years / Shallow tillage C Shallow tillage with cultivator D Permanent ley
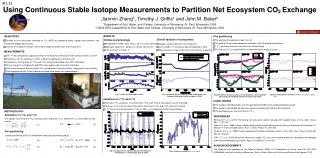
Studying the effect of cultivation intensity on CO2emissions Measurements An automatic CO2 emission measuring system with infrared (IRGA) gas analysers is used (ADC Automated Soil CO2 Exchange System) The system also includes sensors for measuring PAR (Photosynthetically active radiation) Soil temperature Soil moisture Yield Soil physical and chemical properties
Soil properties and Yield Treat. Tot-C % Tot-N % pH LOI (%) Yield (Ton/ha) A 27.00 1.72 7.79 47.84 6.34 B 28.61 1.83 7.81 47.91 6.44 C 28.05 1.80 7.79 47.48 5.98 D 36.48 2.49 7.47 66.02 7.85 A ploughing every year B ploughing 1 out of 4 years C only stubble cultivation D permanent ley
Conclusions • Larger emissions could be observed just after cultivation and that effect lasted for about one day. • The average emission was highest from treatment D during 2012 and treatment C and D during 2013