Download
1 / 25
250 likes | 370 Views
Brazil. Area: 8.5 mln Km2 States: 28 Population: 176 mln Life Expectation: 69 years Unemployment: 7.3% GDP (US$): 500 bln Currency: Real (R$3,00=US$1,00). 180. 33. 33. 32. 160. 34. 33. 34. 35. 33. 33. 34. 35. 140. 37. 120. 100. 80. 141. 140. 138. 134. 133. 129. 60.

E N D
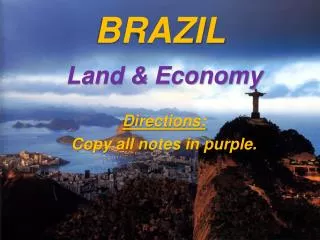
Brazil Area: 8.5 mln Km2 States: 28 Population: 176 mln Life Expectation: 69 years Unemployment: 7.3% GDP (US$): 500 bln Currency: Real (R$3,00=US$1,00)
180 33 33 32 160 34 33 34 35 33 33 34 35 140 37 120 100 80 141 140 138 134 133 129 60 126 126 124 121 117 112 40 20 1991 1992 1993 1994 1995 1996 1997 1998 1999 2000 2001 2002 Brazil Population Country Urban
Number of Credit Cards (mln) Total Expenses (US$ bln) Credit Cards 45 40 35 30 25 20 15 10 5 0 1997 1998 1999 2000 2001 2002
Income Held by the Richest 10% of the Population 80% 70% 60% 50% 40% 30% 20% 1995 1991 1990 1992 1993 1994 1996 1997 1998 1999
5.200 4.866 4.993 4.755 4.700 4.981 4.399 4.891 4.553 4.200 4.423 3.700 3.584 3.255 3.200 3.181 2.700 2417 2.200 1991 1995 1997 2002 1996 2001 1994 1992 1993 1998 1999 2000 Per Capita Income US$
Regions Productivity 35 tons/ha 50 tons/ha 51 tons/ha 65 tons/ha 67 tons/ha 75 tons/ha 50 tons/ha 73 tons/ha 70 tons/ha 75 tons/ha 78 tons/ha 48 tons/ha 40 tons/ha 82 tons/ha Cane Production: - 1 mlm / ton 80 tons/ha
51% 46% 35% 173 167 Cane Production Evolution Estimate: 340 million tons Million Tons 350 300 250 118 143 111 172 151 152 102 93 200 126 77 77 150 100 185 178 170 156 154 151 147 147 141 139 130 50 0 03/04 02/03 92/93 93/94 94/95 95/96 96/97 97/98 98/99 99/00 00/01 01/02 Sugar Ethanol
Sugar Balance CS NNE Brazil Stocks Forecast 30 April, 2002 118 696 814 2002/03 Crop 18.698 3.730 22.428 Production 7.056 1.785 8.841 Consumption 11.350 2.150 13.500 Exports 200 (200) 0 Transference (CS - NNE) 210 691 901 Stocks Forecast 30 April, 2003 2003/04Crop 18.700 3.620 22.320 Production 7.120 1.800 8.920 Consumption 11.000 2.000 13.000 Exports 350 (350) 0 Transference (CS - NNE) 440 861 1.301 Stocks Forecast 30 April, 2004 % Variation 2003/04 Vs 2002/03 0% (3%) 0% Production 1% 1% 1% Consumption (3%) (7%) (4%) Exports 75% 75% - Transference (CS - NNE)
VHP Export No5 export ESALQ Anhydrous 45,00 (ex-mill) 41,00 37,00 33,00 R$/50kg Equivalent 29,00 25,00 21,00 17,00 13,00 9,00 5,00 jun/00 jun/01 jun/02 fev/00 fev/01 fev/02 fev/03 out/00 out/01 out/02 abr/00 abr/01 abr/02 dez/00 dez/01 dez/02 ago/00 ago/01 ago/02 Export Parity
Brazilian Exports per Port in 2002/03 Crop (000 tons) 76 525 1.467 202 28 8.132 2.463 69 165 Others
Soil Varieties Types of Soil: Productivity t/ha A1 >100 A2 96-100 B1 92-96 B2 88-92 C184-88 C2 80-84 D1 76-80 D2 72-76 E1 68-72 E2 < 68 C / D / E C / D C / D A2 / B / C
Rainfall Pattern Rainfall: A - 1000 - 1300 mm B - 1300 - 1600 mm C - 1600 - 1900 mm D - 1900 - 2200 mm E - 2200 - 2500 mm B D E D A C B A
EU Raw VHP Crystal Refinned Brazilian Exports per Sugar Type mln tons mttq 14 12 10 8 6 4 2 0 2000/01 2001/02 2002/03
Other Sugar Cane Products • Energy Co-generation; • Yeast for animal food; • Molasses for yeast production and for export; • Vinasse for irrigation and fertilisation; • Filter waste for fertilisation; • Carbon Credit Sales.
Parcel of the Area Allowed to Burn Non-Mechanisable Mechanisable Area Area 2002 80% 100% 2006 70% 100% 2011 50% 90% 2016 20% 80% 2021 0% 70% 2026 0% 50% 2031 0% 0% Environmental Issues • Cane Burning During the Harvest: • Sao Paulo State approved a law to abolish the cane burning until 2031, according to the table below.
Environmental (Carbon Credit, Childhood labour and Bio Diesel) • Around 20 mills are implementing carbon credits .. programmes. • A mill that produces 100 mln litres of alcohol can have an . extra income of around US$ 1.1 mln with carbon credits. • Biodiesel blend of 5% on the conventional diesel is under .. National Petroleum Agency analysis. • 61 mills in Brazil are enrolled in childhood labour combat .. programme.
Weaknesses and Strengths Strengths • Brazilian industry is less exposed to the ....international sugar prices than others. Industry Diversity • Other sugar cane products helps to reduce the ....dependence of sugar and alcohol. • Strong lobby with the Government. Political Environment • The generation of US Dollar income increases .. the industry political power. • The devaluated currency increases Brazilian ......competitiveness in the world market. Currency • Lower production costs. Other • High potential for area expansion.
Weaknesses and Strengths Weaknesses • Long distances between CS mills and ports increases ...freight cost. Logistics • Poor rail system. • Competition with soya at the port terminals in the CS. • Long vessel lines during season causes shipment delays. Political Environment • Poor industry co-ordination. Marketing Features • Lack of an overseas marketing programme.
Weaknesses and Strengths Weaknesses • Can be addressed via Additional Investment though ....raises total cost - especially to produce No.11 ....deliverable sugar Logistics Political Environment • Industry needs to become aligned Marketing Features • Requires change of approach
MarketingFeatures • Limited knowledge of Overseas Markets • Customers are a handful of International Trade Houses • Sales dependent upon Sugar Trade requirement and ...not end user driven / limited direct relationships • Exposed to ‘Trade Squeeze’ • F.O.B. sales to the Trade results in loss of control and ...higher logistics costs and potential port delays • Lack of knowledge of end user requirements exposes ...Brazilian industry to adverse changes in market place • Brazilian industry adopts a speculative approach to sales, ...which is not end user focused and creates volatility
Conclusion • Brazil will continue to grow • Will continue to be the lowest cost producer • Will continue to diversify in products and industry complexity • Ethanol reassumes strategic importance in the longer term
Conclusion How to meet this challenge? • Queensland must aim to be the second most competitive .. ...Producer, driving down domestic cost of production: • Maintain and develop excellent relationship with customers • Continue to be the preferred origin to the majority of first . ...class global raw sugar buyers • Make every effort to jealously guard the geographical . . ...advantage Australia has in the Far East marketplace