Download
1 / 1
10 likes | 98 Views
1394. CRYSTAL STRUCTURE PARAMETERS AS PREDICTORS OF VNIR SPECTROSCOPY OF SYNTHETIC PYROXENES

E N D
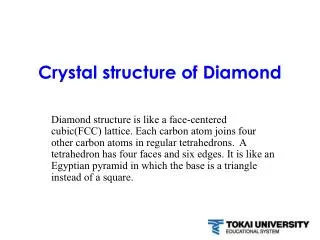
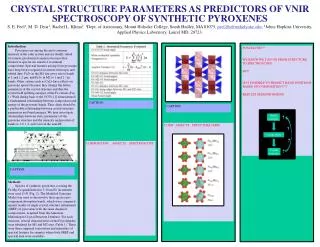
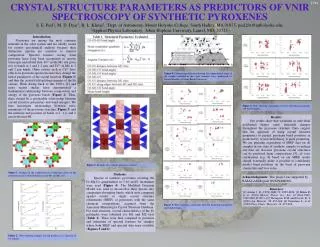
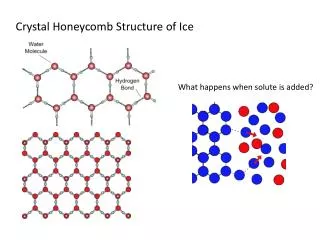
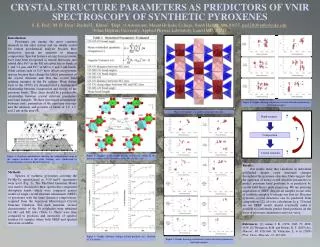
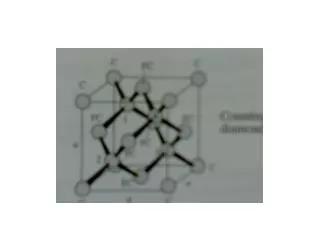
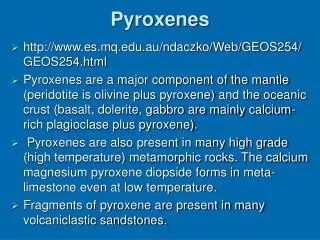
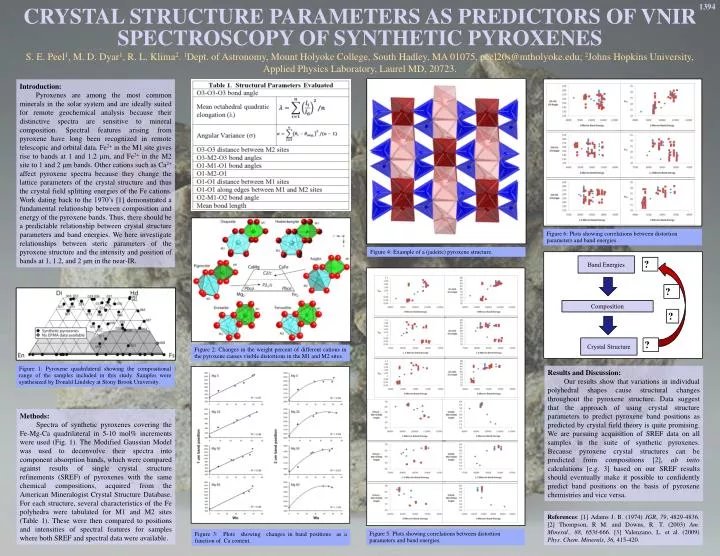
1394 CRYSTAL STRUCTURE PARAMETERS AS PREDICTORS OF VNIR SPECTROSCOPY OF SYNTHETIC PYROXENES S. E. Peel1, M. D. Dyar1, R. L. Klima2. 1Dept. of Astronomy, Mount Holyoke College, South Hadley, MA 01075, peel20s@mtholyoke.edu; 2Johns Hopkins University, Applied Physics Laboratory, Laurel MD, 20723. Band Energies ? ? Composition ? Introduction: Pyroxenes are among the most common minerals in the solar system and are ideally suited for remote geochemical analysis because their distinctive spectra are sensitive to mineral composition. Spectral features arising from pyroxene have long been recognized in remote telescopic and orbital data. Fe2+ in the M1 site gives rise to bands at 1 and 1.2 m, and Fe2+ in the M2 site to 1 and 2 μm bands. Other cations such as Ca2+ affect pyroxene spectra because they change the lattice parameters of the crystal structure and thus the crystal field splitting energies of the Fe cations. Work dating back to the 1970’s [1] demonstrated a fundamental relationship between composition and energy of the pyroxene bands. Thus, there should be a predictable relationship between crystal structure parameters and band energies. We here investigate relationships between steric parameters of the pyroxene structure and the intensity and position of bands at 1, 1.2, and 2 μm in the near-IR. Crystal Structure ? Figure 6: Plots showing correlations between distortion parameters and band energies. Figure 4: Example of a (jadeite) pyroxene structure. Figure 2: Changes in the weight percent of different cations in the pyroxene causes visible distortions in the M1 and M2 sites. Figure 1: Pyroxene quadrilateral showing the compositional range of the samples included in this study. Samples were synthesized by Donald Lindsley at Stony Brook University. Results and Discussion: Our results show that variations in individual polyhedral shapes cause structural changes throughout the pyroxene structure. Data suggest that the approach of using crystal structure parameters to predict pyroxene band positions as predicted by crystal field theory is quite promising. We are pursuing acquisition of SREF data on all samples in the suite of synthetic pyroxenes. Because pyroxene crystal structures can be predicted from compositions [2], abinito calculations [e.g. 3] based on our SREF results should eventually make it possible to confidently predict band positions on the basis of pyroxene chemistries and vice versa. Methods: Spectra of synthetic pyroxenes covering the Fe-Mg-Ca quadrilateral in 5-10 mol% increments were used (Fig. 1). The Modified Gaussian Model was used to deconvolve their spectra into component absorption bands, which were compared against results of single crystal structure refinements (SREF) of pyroxenes with the same chemical compositions, acquired from the American Mineralogist Crystal Structure Database. For each structure, several characteristics of the Fe polyhedra were tabulated for M1 and M2 sites (Table 1). These were then compared to positions and intensities of spectral features for samples where both SREF and spectral data were available. References: [1] Adams J. B. (1974) JGR, 79, 4829-4836. [2] Thompson, R M. and Downs, R. T. (2003) Am. Mineral., 88, 653f-666. [3] Valenzano, L. et al. (2009) Phys. Chem. Minerals, 36, 415-420. Figure 5: Plots showing correlations between distortion parameters and band energies. Figure 3: Plots showing changes in band positions as a function of Ca content.