Download
1 / 25
260 likes | 404 Views
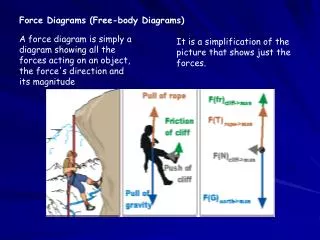
Feynmann Diagrams. Feynman Diagrams. Feynman Diagrams. Vertices. Virtual processes. Real processes. For a real process there must be energy conservation it has to be a combination of virtual processes. Electron-electron scattering, single g exchange

E N D
Real processes • For a real process there must be energy conservation • it has to be a combination of virtual processes. • Electron-electron scattering, single g exchange • Any real process receives contributions from • all possible virtual processes.
Points at which 3 or more particles meet are called vertices • Each vertex corresponds to a term in the transition matrix element • which includes the structure and strength of the interaction. • The nr. of vertices in a diagram is called order • Each vertex has an associated probability proportional to a coupling • constant, usually denoted as a. In the em processes this is: • For the real processes, a diagram of order n gives a contribution • of order an • -Providing that a is small enough, higher order contributions to • many real processes can be neglected
Diagrams which differ only by time-ordering are usually implied by • drawing only one of them • This kind of process: • Implies 3!=6 different time orderings
From the order of diagrams the ratio of rates of processes can be • estimated: • For example, this ratio measured appears to be: R = 0.9 x 10⁻³, • smaller than aem (but estimate is only a first order prediction) • For nucleus, coupling is proportional to Z2a, hence the rate for this • process is of order Z2a3
Exchange of a massive boson • In the rest frame of particle A: • where: • From this one can estimate the max distance • over which X can propagate: • This energy violation can be only for • The interaction range is:
For a massless exchanged particle, the • interaction has an infinite range (e.g: em) • -If the exchanged particle is very heavy (like the W boson in the • weak interaction), the interaction can be approiximated by a • zero-range or point interaction • If one consider the particle X as an electrostatic potential V(r), • then the Klein-Gordon equation looks like
Yukawa Potential (1935) • Integration of previous equation gives: • g is an integration constant, interpreted as the strength of the coupling of particle X to particle A and B (strong nuclear charge) • Yukawa theory described the short-range nature of force between n and p in nucleus: interaction is due to massive quanta • -In Yukawa theory, g is analogous to the electric charge in QED, and the analogue of aem is: ax = g2/4p • ax characterizes the interaction strength at distances: r < R
A particle is scattered by this potential, thus receivig a momentum • transfer . • The potential has an amplitude (which is its Fourier transform): • - Using polar coordinates: • and assuming: , the amplitude is: • For the point interaction, M2X >> q2 hence : • The point-interaction is characterized not only by aX, • but also by MX
For nuclear forces with a range R ~ 10-15 m, Yukawa hypothesis predicted a spinless quantum of mass: Mc2 = hc/2pR 100 MeV. The pion observed in 1947 hadM = 140 MeV, spin 0 and strong nuclear interactions. Nowadays: pion exchange still accounted for the longer-range part of nuclear potential. However, full details of interaction are more complicated
Exercises • Knowing the dimensions of neutron and protons, you can estimate • the mass of the particle, which is responsible for the interaction • between the nucleus • Hint: • The interaction between charged particles is carried by • photons. The range of this interaction is infinite, the rest mass of • photon has to be zero. The interaction between nucleons is limited • to a range of about 10-15 m. • The Heisemberg uncertainty relation allows fluctuation of energy for a very short time, so that ”virtual” particles can be created which are responsible for the interaction
Solution: r =c.Dt Dt = r/c = 3.34.10-24 s DEDt h/4pDE = h/(4pDt) ~ 100 MeV The uncertainty relation for a distance from 10-15 m allows a max energy deviation of about 100 MeV. A particle which is responsible for the interaction of two nucleons should have a mass in the order of 100 MeV but can only exist for about 10-24 s