Download
1 / 20
210 likes | 295 Views
5.1: Randomness, Probability and Simulation. Section 5.1 Randomness, Probability and Simulation. After this section, you should be able to… DESCRIBE the idea of probability DESCRIBE myths about randomness DESIGN and PERFORM simulations. The Idea of Probability

E N D
Section 5.1Randomness, Probability and Simulation After this section, you should be able to… • DESCRIBE the idea of probability • DESCRIBE myths about randomness • DESIGN and PERFORM simulations
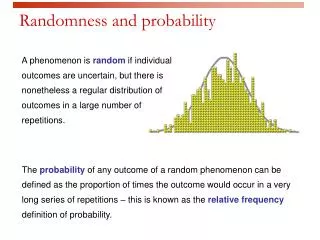
The Idea of Probability Chance behavior is unpredictable in the short run, but has a regular and predictable pattern in the long run. The probability of any outcome of a chance process is a number between 0 (never occurs) and 1 (always occurs) that describes the proportion of times the outcome would occur in a very long series of repetitions.
The Law of Large Numbers The law of large numbers says that if we observe more and more repetitions of any chance process, the proportion of times that a specific outcome occurs approaches a single value.
Myths about Randomness The myth of short-run regularity: The idea of probability is that randomness is predictable in the long run (1 million plus occurrences). Probability does not allow us to make short-run predictions. The myth of the “law of averages”: Probability tells us random behavior evens out in the long run. Future outcomes are not affected by past behavior. Women have a 50% of having a boy with each pregnancy; the gender of any previous children do not matter!
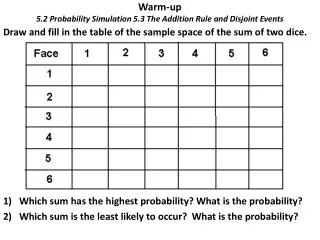
Performing a Simulation The imitation of chance behavior, based on a model that accurately reflects the situation, is called a simulation. Simulations are usually done with a table of random digits, calculator random number generator (RandInt) or computer software. State: Identify the probability calculation at interest. Plan: Describe how to use a chance device/tool to implement one repetition of the process. Explain clearly how to identify the outcomes of the chance process. Do: Perform many (at least 20) repetitions of the simulation. Conclude: Use the results of your simulation to answer the question of interest, in context.
Performing a Simulation For Example: What is the probability that a student earns an 80% on a true/false quiz written in Chinese? (Assume the exam taker does not know any Chinese). Should the instructor be concerned about cheating? How can we simulate the probability of guessing 80% correct on a True/False quiz?
Required Elements: • State must include: • Identify variable • Statement of probability in symbols or words. • Plan must include: • What tool? • What values are you assigning? • How many values are you picking each time? • How many times are you conducting the simulation? • What about repeat digits or ignored digits? • What are you recording?
Required Elements: • Do must include: • Simulation data, if number of trials is 20 or less • Summary of data for larger trials • Conclude must include: • Statement of probability • Answer to question • Usually about being surprised/reasonable/expected, etc.
The Golden Ticket At a local high school, 95 students have permission to park on campus. Each month, the student council holds a “golden ticket parking lottery” at a school assembly. The two lucky winners are given reserved parking spots next to the school’s main entrance. Last month, the winning tickets were drawn by a student council member from the AP Statistics class. When both golden tickets went to members of that same class, some people thought the lottery had been rigged. There are 28 students in the AP Statistics class, all of whom are eligible to park on campus. Design and carry out a simulation to decide whether it’s plausible that the lottery was carried out fairly. **See 5.1 WS
STATE: • What is the probability that the lottery would result in two winners from the AP Stats class? • P (X=2), where x is the number of winners from AP Stats
PLAN: Using the table of random digits, we will randomly assign each student a two digit number from 01 to 95. We’ll label the students in the AP Statistics class from 01 to 28, and the remaining students from 29 to 95. (Numbers from 96 to 00 will be skipped.) Starting at the randomly selected row 139 and moving left to right across the row, we’ll look at pairs of digits until we come across two different values from 01 to 95. These two values will represent the two students with these labels will win the prime parking spaces. We will record whether both winners are members of the AP Statistics class (Yes or no). We will conduct the simulation 18 times.
Required Elements: • Plan must include: • What tool? • Table of Random of Digits, Calculator Random Number Generator (RandInt), etc. • What values are you assigning? • 01 to 95 • How many values are you picking each time? • 2 values • How many times are you conducting the simulation? • 18 times • What about repeat digits or ignored digits? • Ignore repeat digits within a single draw • What are you recording? • Yes for both AP Stats.
DO: Reading across row 139 in Table D, look at pairs of digits until you see two different labels from 01-95. Record whether or not both winners are members of the AP Statistics Class.
CONCLUDE: Based on 18 repetitions of our simulation, both winners came from the AP Statistics class 3 times, so the probability is estimated as 16.67%. Therefore is definitely possible for two AP Stats students to be selected in a “fair” drawing.
NASCAR In an attempt to increase sales, a breakfast cereal company decides to offer a NASCAR promotion. Each box of cereal will contain a collectible card featuring one of these NASCAR drivers: Jeff Gordon, Dale Earnhardt, Jr., Tony Stewart, Danica Patrick, or Jimmie Johnson. The company says that each of the 5 cards is equally likely to appear in any box of cereal. A NASCAR fan decides to keep buying boxes of the cereal until she has all 5 drivers’ cards. She is surprised when it takes her 23 boxes to get the full set of cards. Should she be surprised? Design and carry out a simulation to help answer this question.
STATE: What is the probability of needing to buy 23 or more cereal boxes to obtain one card from each driver?
PLAN: Using the calculator's random number generator (RandInt) we are going to simulate 50 trials. We will assign each driver a unique number 1 through 5. We will record how many trials it takes to get all five values (drivers). We will record the total number of digits required each time.
DO: Dotplot of 50 Trials
CONCLUDE: We never had to buy more than 22 boxes to get the full set of cards in 50 repetitions of our simulation. Our estimate of the probability that it takes 23 or more boxes to get a full set of driver is roughly 0. Therefore, she should be surprised that it took 23 cereal box purchases to find all 5 driver cards.