Download
1 / 45
450 likes | 451 Views
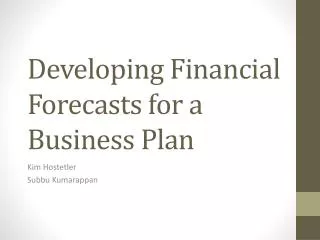
Learn how to develop pro forma financial statements for new ventures, including projecting sales and revenues, assessing expenses, and analyzing financial investment needs.

E N D
4. Developing Pro Forma Fin. Statements, Projecting CF’s & Profits, Assessing Fin. Needs 4.1 Introduction to Pro Forma Financial Statements for NV’s 4.2 Foundation of New Venture Financial Pro Formas: Projecting Sales and Revenues Methods 4.2.1 Type of Business 4.2.2 Review of Theory of Demand, the Demand Function, Econometric Model of Demand, Elasticities 4.2.3 New Product Life Cycle Curve: Bass Model or the “S” Curve 4.2.4 Growth Rate Escalation Method 4.2.5 Market Potential and Saturation Method 4.2.6 Estimating Expected Revenues from Large, Discrete Contracts
4.Developing Pro Forma Fin. Statements, Projecting CF’s & Profits, Assessing Fin. Needs 4.3 Projecting Expenses 4.4 Links Between Cash Flows, Net Income, and Balance Sheets 4.5 Assessing Financial Investment Needs 4.5 Risk Analysis 4.6 Review of Various New Venture Pro Forma Financials
4.1 Introduction to Pro Forma Financial Statements for NV’s • Pro Forma translated from Latin is “for the sake of form” • A pro forma financial statement is a hypothetical financial statement that is based on a set of assumptions • NV pro formas: future year projections based on little if any history
4.1 Introduction to Pro Forma Financial Statements for NV’s Uses of a pro forma for the NV: • Way to evaluate how much cash the business is likely to require and the CF requirements if the business grows at a different rate than expected • Basis for evaluating and valuating the venture and for assessing strategic alternatives • Required by VC’s for evaluating and valuating the venture; basis for negotiation of pre- and post-money valuations • Used as a benchmark to compare actuals v. projections; feedback for needed changes in direction or abandoning the venture
4.1 Introduction to Pro Forma Financial Statements for NV’s • The most important NV pro forma financial statement: Statement of Cash Flows • The survival of the venture is based on cash, not net income • Need income statement to develop cash flow statement • NV business plans usually include income and cash flow statements, may or may not include balance sheet
4.2 Foundation of New Venture Financial Pro Formas: Projecting Sales and Revenues Methods • The revenue forecast is the driver of the pro forma financials and many aspects of the BP. • Total Revenue = Price (P) x Sales (Qd) • Sales and price forecasts drive revenues, expenses, and resource needs. • Risk analysis is highly driven by sales, price and revenue projections.
4.2.1 Types of Business • Sales, price and revenue projection methods will be driven by type of business: • Mass market: mass / database marketing • E.g., Website visitation • E.g., Retail sales • Large contract, client driven: Relationship marketing • E.g., Consulting • E.g., Commercial construction • E.g., Information systems sales and service
4.2.1 Types of Business • Sales, price and revenue projection methods will be driven by type of business: • Mass market: • Sales projections based on percent market saturation • Product life cycle model such as the Bass model • May use an econometric model if have a track record: • Demand equation from microeconomics
4.2.1 Types of Business • Sales, price and revenue projection methods will be driven by type of business: • Large contract, client driven: • Sales projections based on the expected value of a small number of large, identifiable or generic projects / contracts • Sales and revenues are usually phased-in yet and lumpy (large jumps in revenue as projects generate revenues: • E.g.’s Energy services projects ($100k-$10m, oil rig sales ($50m - $100m) • Price projections based on quantitative value to the client and results of negotiations • Large leads in cash outflow before cash inflows
4.2.2 Review of Theory of Demand, the Demand Function, Econometric Model of Demand, Elasticities Price Qd
4.2.2 Demand Function and Econometric Equation Demand Curve: Qd = f(P) cet. par. Demand Function: Qd = f(P, Psubs, Advertising $, Income, …) where: P = product price Psubs = price of substitutes Income = relevant measure of income, such as GDP, national income, average customer household income, …
4.2.2 Demand Function and Econometric Equation Econometric Equation of Sales: where: Pt-1 = product price in previous period Psubs,t-1 = price of substitutes in previous period Incomet-1 = relevant measure of income, such as GDP, national income, average customer household income, in previous period α0, …, αn = regression coefficients X1,t-1, …, Xn,t-1= other variables that drive sales εt = error term and expect that α2, α3, α4are positive and α1 is negative
4.2.2 Demand Function and Econometric Equation Econometric Equation of Sales: where the price elasticity of sales (percentage change in sales for a percentage change in price):
4.2.2 Demand Function and Econometric Equation Econometric Equation of Sales: where the income elasticity of sales (percentage change in sales for a percentage change in income):
4.2.2 Demand Function and Econometric Equation • Elasticities: • Useful for strategic pricing • Price inelastic means that revenues will rise with a price increase • Income elastic means that sales and revenues are very sensitive to the level of economic activity
4.2.2 Demand Function and Econometric Equation • Econometric Equation of Sales: • Useful only if secondary information is available or can be estimated • Secondary information would be the estimation of a demand equation based on similar product sales and data • Estimate for another similar product where the data is available and use to project sales and strategic decisions • Typically used for projections by mass market businesses with a history of sales and price information
4.2.3 New Product Life Cycle Curve: Bass Model or the “S” Curve • The marketing research literature has concluded that new product life cycle curves typically follow an S pattern:
4.2.3 New Product Life Cycle Curve: Bass Model or the “S” Curve • The new product sales model explains this S-curve shape based on diffusion theory. • Diffusion theory is actually a theory of communication regarding how information is dispersed within a social system over time. • The consumer product adoption process based on relative adoption time categorizes individuals as : • innovators, early adopters, early majority, late majority, and laggards. • Diffusion theory can be used to develop a systematic method for projecting sales that is more justifiable then rationalized conjecture • Room air conditioners, TV’s, VCR’s, PC’s, cell phones to name a few products, all followed a “S” curve form of market saturation
4.2.3 New Product Life Cycle Curve: Bass Model or the “S” Curve • There are at least three major types of models that have been proposed for forecasting new product first purchase sales: • Pure Innovative Models (e.g., Fourt and Woodlock 1960) • Pure Imitative Models (e.g., Fisher and Pry 1971, Mansfield 1961) • Combination Models (e.g., Bass 1969)
4.2.3 New Product Life Cycle Curve: Bass Model or the “S” Curve
4.2.3 New Product Life Cycle Curve: Bass Model or the “S” Curve where: Qt = number of adopters or unit sales at time t p = coefficient of innovation, or “the likelihood that somebody who is not yet using the product will start using it because of mass media coverage or other external factors” [Van den Bulte (2002)] q = coefficient of imitation, or “the likelihood that somebody who is not yet using the product will start using it because of "word-of-mouth" or other influence from those already using the product” [Van den Bulte (2002)] M = market size, or ultimate number of adopters or unit sales A = cumulative number of adopters or unit sales to date
4.2.3 New Product Life Cycle Curve: Bass Model or the “S” Curve
4.2.3 New Product Life Cycle Curve: Bass Model or the “S” Curve • Use the Bass Model: • Obtain p and q from a similar type of product from the marketing literature or estimate them for a similar product • Estimate own M (or size of market for your product) and first year sales or adopters • Use M, p, and q to predict Q and A, then apply to predicted price to obtain projected revenues
4.2.4 Growth Rate Escalation Method • Naïve prediction model • Assumes growth rate(s) and used to escalate sales • Based simply on compound growth rates • Usually not based on any theory or experience or assumption other conjecture • Difficult to justify
4.2.5 Market Potential and Saturation Method • Based on analysis of overall size of market and levels of penetration by your venture • Similar to S curve as its based on market potential • Different than S curve as the S curve is based on assumed overall size of market for the venture only • S curve assumed market size (M) should be benchmarked to overall size of the market for long-term market share
4.2.6 Estimating Expected Revenues from Large, Discrete Contracts • Based on knowledge of and relationships with targeted potential clients • Revenue projection based on expected value of revenues generated from each project individually • Develop customer sales cycle and typical time line then use to project each project’s revenues
4.2.6 Estimating Expected Revenues from Large, Discrete Contracts
4.2.6 Estimating Expected Revenues from Large, Discrete Contracts
4.3 Projecting Expenses • Total Cost (TC) = Fixed Cost (FC) + Variable Cost (VC) • In economic theory, FC includes rate of return equal to the opportunity cost of capital to the equity investors • Variable cost items are driven by sales by definition • Cost of goods sold purely driven by sales • Fixed costs items are driven by scale of the business and business type • Cash Flow Cycle identified employees, materials, and fixed assets • Capital intensive businesses require high levels of fixed assets compared to other factor inputs: • E.g., consulting firm have little fixed cost; physical product manufacturing businesses such as electric power generation or petroleum extraction have very high fixed cost
4.3 Projecting Expenses • Review microeconomic theory of cost; helpful in understanding how costs grow and defining a cost • Review TC, average TC (ATC), average FC (AFC), and average VC (AVC) and marginal cost (MC) curves: • Review long-run average cost curve and economies of scale
4.3 Projecting Expenses • See integrated pro forma financials template for typical expense items for a NV • List all assumptions to your pro forma revenue and expense projections as notes to accompany pro formas: • Pricing (value-based, cost-plus) • Method for forecasting sales • Timing of fixed asset commitments • Terms of loans • Salaries by person or title • Describe assumptions of any material expense
4.4 Links Between Cash Flows, Net Income, and Balance Sheets • The three financial statement are interdependent and linked by accounting methods • Income Statement changes affect Balance Sheet and Cash Flow (e.g., higher profit may lead to increased cash balances). • Balance Sheet changes affect Income Statement and Cash Flow (e.g., borrowing leads to interest expense and reduces taxes). • An financial model should integrate the statements • Ideally, pro forma income, cash flow, and balance sheet financial statements and sources and uses of funds should be developed • The most important is the statement of cash flows as the NV financial decisions, planning and basis for survival are based on cash flow and cash needs
4.4 Links Between Cash Flows, Net Income, and Balance Sheets • Profitability is not the same as cash flow: • Non-cash revenues may increase NI but reduce CF as credit is extended to the customer • Capital acquisitions will decrease CF by the amount of the purchase at the time of payment but not affect NI • Only affect NI when depreciated or “expensed” over its useful life; depreciation will affect NI but not CF • Reflected as a fixed or long-term asset and liability is recorded based on how funds obtained (e.g. credit long-term debt) • See integrated pro forma income, CF, and balance sheet templates
4.4 Links Between Cash Flows, Net Income, and Balance Sheets Pro Forma Forecasting: No track record to rely on Yardstick Approach: • Comparable firms in relevant dimensions • IPO prospectuses • Other data sources: • Value Line or other investment information sources • Trade Show Exhibits and Conference Paper Presentations • Public Record Bids
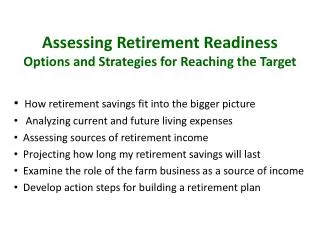
4.5 Assessing Financial Needs • Based on the shortfall in cash flow projection from pro formas • Identifies specific sources of cash: • CF from operations • CF from loans (identify creditors and amounts) • CF from equity (identify investors and amounts may be a confidentiality or strategy issue here) • Identifies uses of cash and schedule of needs
New Company Assumptions • Development will require 18 months, during which no sales will be made. • Initial sales of $10,000 in the 19th month. • Sales will grow 8% per month in real terms for three years and at the inflation rate thereafter. • Cash operating expenses during the development period of $15,000 per month, plus inflation. • Inflation at 9 percent per year.
New Company Assumptions • A $200,000 production facility will come on line at the end of month 18. The facility is to be leased by the company for the first 5 years of operation, with monthly payments of $3,000. • Gross profit of 60% of sales revenue on materials costs with trade discounts. • Selling expenses of 15% of sales. • Administrative expenses of $2,000 per month beginning in month 19, growing at the inflation rate, plus 15 percent of sales (Included in development period operating expense total).
New Company Assumptions • Entrepreneur’s salary of $3,000 per month through the first full year of sales. (included in initial operating expenses), increasing thereafter by $500 per month. • Corporate tax rate of 45%. No loss carry forward. • All sales are for credit. The average collection period is 45 days. No discount for prompt payment. • The inventory turnover rate is 5 times per year, measured against ending inventory.
New Company Assumptions • The company desires to maintain the greater of 30 days’ sales in cash or $10,000. • All materials are purchased on credit, with terms of net 30. The company anticipates paying in time to receive the discount. The payables period is 10 days. • The entrepreneur will borrow any funds necessary at a rate of 1% per month. • Initial investment by the entrepreneur of $200,000. Additional financing as needed by borrowing on a line of credit.
4.5 Risk Analysis • Modeling uncertainty is more important for a NV than established business • Expected projection is an anchor for forecasts of uncertainty / scenarios • Base on comparable companies • Envision alternative realistic scenarios and reflect in pro forma projections and estimate probabilities • Determine 3-4 key risk driving variables and re-do projections based on these scenarios • Use monte carlo simulation for large NV investments
4.5 Review Various NV Pro Formas • Discuss results from cases