Download
1 / 47
470 likes | 691 Views
17. Projecting Cash Flow and Earnings. Learning Objectives. Help yourself grow as a stock analyst by knowing: How to obtain financial information about companies. How to read basic financial statements. How to use performance and price ratios.

E N D
17 Projecting Cash Flowand Earnings
Learning Objectives Help yourself grow as a stock analyst by knowing: • How to obtain financial information about companies. • How to read basic financial statements. • How to use performance and price ratios. • How to use the percentage of sales method in financial forecasting.
Earnings and Cash Flow Analysis • Our goal in this chapter is to show you the financial accounting concepts necessary to: • Understand basic financial statements, and • Perform earnings and cash flow analysis using basic financial statements. • Keep in mind: Cash flow is a company’s lifeblood.
Sources of Financial Information, I. • An excellent primary source: annual reports • Visit www.wsj.com, enter a stock symbol in the appropriate box. • A company research page appears. • Click on “Annual Reports.” • Free service for subscribers of The Wall Street Journal. • Internet • The New York Stock Exchange web site provides a directory of web sites for companies listed on the NYSE. • Web sites, like finance.yahoo.com, provide some financial information • Much info at the Investor Relations area of a company’s web site.
Sources of Financial Information, II. • The Securities and Exchange Commission (SEC) requires companies to prepare and submit regular reports • When received by the SEC, these reports are freely made available through Electronic Data Gathering and Retrieval (EDGAR) archives. • 10K: Annual company report filed with the SEC. • 10Q: Quarterly updates of 10K reports. • Companies file many reports with the SEC.
Sources of Financial Information, III. • Also, the SEC Regulation FD (Fair Disclosure) requires companies making a public disclosure of materialnonpublicinformation to do so fairly without preferential recipients. • Materialnonpublicinformationis previously unknown information that could reasonably be expected to affect the price of a security. • Most companies satisfy Regulation FD by distributing important announcements via e-mail alerts to those who register for the service at the company’s website (look in the investor relations section).
Three Important Financial Statements • The Balance Sheet: • Provides a snapshot view of a company’s assets and liabilities. • The Balance Sheet is as of a particular date. • The Income Statement: • Provides a summary of a firm’s revenues and expenses. • The Income Statement is over a specific accounting period, usually a quarter or a year. • The Cash Flow Statement: • Is an analysis of the sources and uses of cash by the firm over an accounting period. • Summarizes operating, investing, and financing cash flows.
Assets = Liabilities + Equity The Balance Sheet • Asset- Anything a company owns that has value. • Liability - A firm’s financial obligation. • Equity- An ownership interest in the company. • The fundamental accounting identity:
Net income = Revenues – Expenses • = Dividends + Retained earnings The Income Statement • Income- The difference between a company’s revenues and expenses. • Income is used to: • pay dividends to stockholders or, • kept as retained earnings to finance future growth.
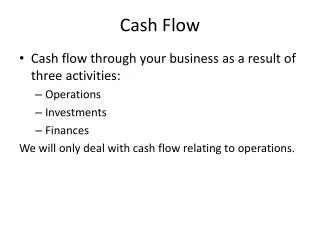
The Cash Flow Statement • Net Incomedoes not equal cash flow. • Net income contains non-cash items. • Non-cash items are income and expenses not realized in cash form. • Depreciation can be a significant non-cashitem. • Cash flow represents all income realized in cash form. • Adjusting net income for non-cash items yields Operating CashFlow. • Investment Cash Flow includes any purchases or sales of fixed assets and investments. • Financing Cash Flowincludes funds raised by issuing securities, or expended by repurchasing outstanding securities.
Performance, or Profitability, Ratios • Four common performance ratios often reported in 10Ks and 10Qs to help investors interpret financial information are: • Note thatROA and ROEare calculated using thecurrent year-endvalues fortotal assets and stockholder equity. • Although one could use prior-year values, it is more common to use current year-end values.
Example: Calculating Profitability Ratios • Using the data provided by the Borg Company in the year 2536, we can calculate the profitability ratios:
Price Ratio Inputs • Annual reports will often report per-share calculations of book value, earnings, and operating cash flow. • Per share calculations require the number of shares outstanding. • Cash flow per share uses operating cash flow!
Example: Calculating Price Ratio Inputs • For the Borg Company in the year 2536:
Price Ratios • Using the inputs we just calculated, we can calculate three important Price Ratios:
Example: Calculating Price Ratios • For the Borg Company, these three ratios are:
Financial Statement Forecasting, I. • You are an analyst employed by Vulcan Ventures, and you are assigned as an analyst for the Borg Corp. • In December 2536, Borg announces the completed acquisition of some distribution outlets from Klingon Enterprises, LLC. • The stated purpose of the acquisition is to increase sales. • Borg also announces plans for a marketing campaign—goal: increase sales to $137,500. • Your job is to examine the potential financial impact from these announcements on the Borg Corp. • How do you proceed?
Financial Statement Forecasting, II. • You decide to build pro forma financial statements using the percentage of sales approach. • Under this approach: • Every accounting item increases at the same rate as sales. • This may be reasonable for some items and unreasonable for others—as an analyst you must judge this “reasonableness.” • Reasonable: accounts receivable • Not Reasonable: long-term debt Long-term debt levels are decided by management.
Building the Pro Forma Income Statement, I. • A sales level of $137,500 for year 2537 represents a 25% increase over sales in the year 2536. • Assumptions: • Ratio of total costs to net sales is about 94.55% in 2536. You assume this ratio to be 94.55% in 2537 too. • Depreciation can be handled many ways. As a practical matter, you use the percentage of sales approach. • Depreciation to sales in 2536 was $3,000 / $110,000. • For 2537, you estimate depreciation as: ($3,000 / $110,000) × $137,500 = $3,750.
Building the Pro Forma Income Statement, II. • Assumptions, cont. • Interest Expense: 4% interest on short-term debt, 8% interest on long-term debt, and 5% interest on debt issued to finance the new outlets. • To maintain the ratio of total costs to net sales (94.55%), you use other operating expenses as the “plug” so you set it to $12,500. • Tax rate of 40%. • Dividends are a constant percentage of net income.
Building the Pro Forma Balance Sheet • You assume some balance sheet items vary with sales but others do not (“n/a” is next to the items that do not). • Asset accounts that do: • Cash • Accounts receivable • Prepaid expenses • Materials and supplies • Inventory • However, the only liability account that you assume does is accounts payable.
The Partial Pro Forma Balance Sheet, II. • Inspecting the partial pro forma balance sheet: • Assets are projected to increase by $22,000. • However, without additional financing (i.e., short-term or long-term debt), liabilities and equity will increase by only $4,400. • What do you do about this $17,600 difference (labeled external financing needed (EFN)? • After all, the balance sheet must balance.
The Partial Pro Forma Balance Sheet, III. • First, note that EFN points out a potentially serious problem for Borg: The company cannot increase sales to $137,500 unless it can raise $17,600 in additional financing. • If Borg management does not want to take on more debt or raise more equity, then they cannot increase sales to $137,500. • You assume that the ratio of current assets to current liabilities should remain constant. • This means that Borg should borrow $2,500 more short-term. • This leaves $15,100 to be financed via long-term debt. • These are the amounts shown at the bottom of Table 17.6
Another Scenario to Consider • Hidden assumption: You assumed that Borg was using its fixed assets at 100% of capacity (i.e., increasing sales increased fixed assets). • But suppose there is some capacity slack. • Suppose you find out from Borg management that Borg is currently running at 75% of capacity. • That is, current sales level is 75% of full capacity sales level. Therefore, sales could increase by about 1/3 before any new fixed assets are required.
Notes on this New Pro Forma Balance Sheet • A sales level of $137,500 increases assets (other than fixed assets) by $7,000. • Accounts payable increase by $1,250. • A sales level of $137,500 increases retained earnings by $3,150 (after dividends are paid). • The difference between the increase in assets and the increases in liabilities and shareholder equity would be $2,600 (without additional financing). • The balance sheet balances if Borg borrows $2,600 more in short-term debt.
Projected Profitability and Price Ratios,The Borg Corporation (I) Borg running at full capacity; (II) Borg running at 75% capacity
Projected Stock Prices for Year 2537,The Borg Corporation • Assume that the current stock price is $40. • Which projected stock price is “right”? • Clearly depends on which price ratio financial markets will use to price Borg shares. • Your job as an analyst will be to assess the situation and make an investment recommendation (supported by facts, investigation, and analysis).
Starbucks Corporation,Case Study • The purpose of studying the Borg Corporation was to help you gain an understanding of basic financial statements, and how to make financial projections. • To further illustrate these concepts, let’s perform an analysis using a real company—which provides a challenge! • We will use the 2007 financial statements for Starbucks Corporation. • Suppose sales increases 24.3% or 16.9%? • The numbers that follow are in $thousands (except EPS).
Starbucks Corporation, 2007 and2006 Condensed Income Statements
Pro Forma Statements, Notes I. • The pro forma income statements correspond to a 24.3% increase and a 16.9% increase in sales. • We employ the percentage of sales approach. • Assume that gross margin, operating margin, and interest income are the same percentage of sales for 2008 as they were in 2007 • Assume the tax rate remains constant • Net effect: Profit margin remains constant at about 7.1%. • Assume no dividends are paid • Assume Starbucks will not issue or repurchase shares • All net income will flow to retained earnings • Number of shares remains at 770.1 million • These assumptions lead to EPS of $1.08 and $1.02, respectively.
Pro Forma Statements, Notes II. • Using the high sales estimate, EFN is about $110 million. • Using the low sales estimate, EFN is a negative $130 million. • Current assets grow about $490 million less than net income • Current liabilities increase by about $249 million • Quite the “cash cow” • This is $130 million of “excess” cash. How will management decide to use it? • Buy other companies • Look for new ways to expand the company • Buy back shares • Declare a cash dividend • Existing profit margin enjoyed by Starbucks is such that considerable growth can be financed out of sales.
Projected Profitability and Price Ratios,Starbucks Corporation Analysts Estimates were $23-37 for Starbucks Shares for 2008
Useful Internet Sites • www.nyse.com (The website of the New York Stock Exchange) • www.thestreet.com (see research/tools for earnings estimates) • www.uoutperform.com (reference for a summary for valuing stocks) • www.starbucks.com • Sources for financial statement information: • www.sec.gov (reference for electronic data archives, EDGAR) • www.freeedgar.com (Free EDGAR) • www.annualreportservice.com (Annual Report Service) • www.prars.com (Free Annual Reports) • Useful Internet sites for company analysis: • www.global-reports.com • www.corporateinformation.com
Chapter Review, I. • Sources of Financial Information • Financial Statements • The Balance Sheet • The Income Statement • The Cash Flow Statement • Performance Ratios and Price Ratios
Chapter Review, II. • Financial Statement Forecasting • The Percentage of Sales Approach • The Pro Forma Income Statement • The Partial Pro Forma Balance Sheet • External Financing Needed (EFN) • The Pro Forma Balance Sheet • Projected Profitability and Price Ratios • Starbucks Corporation Case Study