Download

1 / 35
350 likes | 357 Views
This paper explores developments in Hidden Markov Models, including estimating the order of a model and applying decision trees. It also discusses penalized likelihood methods and provides an application to Multiple Sclerosis lesion count data.

E N D
Developments of Hidden Markov Models by Chandima Karunanayake 30th March, 2004
Developments: • Estimating the Order (Number of Hidden States) of a Hidden Markov Model • Application of Decision Treeto HMM
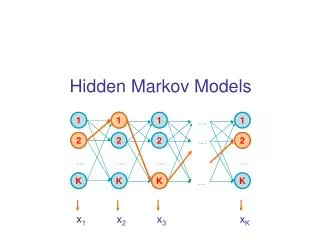
A Hidden Markov Model consists of • A sequence of states {Xt|t T} = {X1, X2, ... , XT} , and • A sequence of observations {Yt |tT} ={Y1, Y2, ... , YT}
Some basic problems: from the observations {Y1, Y2, ... , YT} 1. Determine the sequence of states {X1, X2, ... , XT}. 2. Determine (or estimate) the parameters of the stochastic process that is generating the states and the observations.
Estimating the Order (Number of Hidden States) of a Hidden Markov Model · Finite mixture models Finite mixture model takes the form
Poi (λ1) α1 Poi (λ2) α2 Poi (λ3) α3 Example: Poisson mixture model with m=3 components The density function of Poisson mixture model:
Estimation of the number of components of a finite mixture model • AIC-Akaike Information Criterion • BIC-Bayesian Information Criterion -log likelihood with m components -The number of free parameters in the model -The number of components -sample size m n Most commonly used but not justified theoretically
Solution Penalized likelihood methods -Only for finite number of states • Penalized Minimum distance method (Chen & Kalbfleisch, 1996) • Consistent estimate of the number of components in a finite mixture model
The stationary HMMs form a class of finite mixture models with a Markovian property Chen & Kalbfleisch Idea + Penalized Minimum Distance Method to estimate the number of Hidden States in HMM (MacKey, 2002)
Penalized Distance Let { }, be a family of density functions and G( ) be a finite distribution function on . Then the density function of a finite mixture model is The mixing distribution is
The Penalized Distance is calculated using following way Distance Measure Penalty term -Sequence of positive constants Chen & Kalbfleisch used =0.01n-1/2logn where n is number of observations The penalty proposed here penalizes the overfitting of subpopulations which has an estimated probability close to zero and which differs only very slightly.
The empirical distribution function Different distance measures ) can be used · The Kolmogorov-Smirnov Distance · The Cramer-Von Mises Distance · The Kullback-Leibler Distance
Application to Multiple Sclerosis Lesion Count Data Patients afflicted with relapsing –remitting multiple sclerosis (MS) experience lesions on the brain stem, with symptoms typically worsening and improving in a somewhat cyclic fashion. -Reasonable to assume that the distribution of the lesion counts depends on the patient’s underlying disease activity. -The sequence of disease states is hidden. -Three patients, each of whom has monthly MRI scans for a period of 30 months.
Proposed model: Yit|Zit~ Poisson (μ0Zit) Yit– the number of lesions observed on patient i at time t Zit – the associated disease state (unobserved) μ0Zit- Distinct Poisson means
Number of states Estimated Poisson means Minimum distance 1 4.03 0.1306 2 2.48, 6.25 0.0608 3 2.77, 2.62, 7.10 0.0639 4 2.05, 2.96, 3.53, 7.75 0.0774 5 1.83, 3.21, 3.40, 3.58, 8.35 0.0959 Results: Penalized minimum –distances for different numbers of hidden states
Estimates of the parameters of the hidden process Initial probability matrix Transition probability matrix 0.619 0.381 0.558 0.442
The performance of the penalized minimum distance method ·Number of components · Sample size · Separation of components · Proportion of time in each state
1. Application of Decision Tree to HMM Decision Tree Observed data sequence Ot-1 Ot Ot+1 …. …. Viterbi-labeled states Lj Output probabilitiesPr(Lj, qt=si)
The Simulated Hidden Markov model for the Multiple Sclerosis Lesion Count Data (Laverty et al., 2002) • Transition Probability Matrix • State1 State 2 • State 1 • State 2 • Initial Probability Matrix • State1 State 2 • 0.594 0.406 • Mean Vector • State1 State 2 • 2.48 6.25 0.619 0.381 0.558 0.442
How this works: Tree construction Greedy Tree Construction Algorithm Step 0:start with all labeled data Step 1: while stopping condition is unmet do: Step 2: Find best split threshold over all thresholds and dimensions. Step 3: send data to left or right child depending on threshold test. Step 4: recursively repeat steps 1-4 for left and right children.
The three rules characterize a tree- growing strategy: A splitting rule: that determines when the decision threshold is placed, given the data in a node. A stopping rule: that determines when recursion ends. This is the rule that determines whether a node is a leaf node. A labeling rule: that assigns some values or class label to every leaf node. For the tree considered here, leaves will be associated (labeled) with the state-conditional output probabilities used in the HMM.
Splitting Rules: Entropy Criterion: The highest info-Gain is used to select the attribute to split. The entropy of the set S (units are in bits) Info(T)= where size of S. Infox(T)= Gain(X)=Info(T)-Infox(T)
GINI Criterion: The smallest value of GINI Index is used to select the attribute to split. GINI criteria for splitting is calculated by the following formula: where N-the number of observations in the initial node. -the number of observations of wth class, which corresponds to lth node Nl -the number of observations appropriate to lth new node
Lesion Count Data Count 2 Count > 2 State 1 State 2 Decision Tree
Decision Rule: If count <= 2 Then Classification=State 1 Else Then Classification=State 2
Given the state Can estimate the probabilities that a given state emitted a certain observation. The state-conditional probability at time t and state Si Pr(Ot|qt=Si)
2. Application of Decision Tree to HMM Decision Tree Observed data sequence Ot-1 Ot Ot+1 …. …. The Simplest possible model for the given data
Decision Tree The splitting criterion can be depending on several things: • Type of observed data (independent/autoregressive) ·Type of the transition probabilities (balanced/ unbalanced among the states) ·Separation of Components (well separated or close together)
Observed Data Durbin Watson test Independent Autoregressive ? ? Balanced Balanced Unbalanced ? S S C C S C S Unbalanced ? C S S-Well separated C-Close together
Advantages of Decision Tree • Trees can handle high-dimensional spaces gracefully. • Because of the hierarchical nature, finding a tree-based output probability given the output is extremely fast. • Trees can cope with categorical as well as continuous data.
Disadvantages of Decision Tree • The set of class boundaries is relatively inelegant (rough). • A decision tree model is non-parametric and has many more free parameters than a parametric model of similar power. Therefore this will require more storage and to obtain good estimates a large amount of training data is required.
Reference: ·Foote, J.T., Decision-Tree Probability modeling for HMM Speech Recognition, Ph.D. Thesis, Division of Engineering, Brown University, RI, USA, 1993. ·Kantardzic, M, Data mining: concepts, models, methods and algorithms,New York; Chichester, Wiley, c2003 ·Laverty, W.H., M. J. Miket and I.W. Kelly, Simulation of Hidden Markov models with Excel, The Statistician, Volume 51, Part 1, pp. 31-40, 2002 ·MacKay, R.J., estimating the order of a Hidden Markov Model, The Canadian Journal of Statistics, Vol. 30, pp.573-589, 2002.
Thanking you Prof. M.J. Miket and my Supervisor Prof. W. H. Laverty giving me valuable advice and courage to make this presentation a success.