Download
1 / 17
170 likes | 173 Views
The VIIRS Ice Surface Temperature (IST) EDR provides surface temperatures retrieved at VIIRS moderate resolution for snow/ice covered oceans for both day and night. It uses the baseline split-window algorithm statistical regression method and includes inputs such as VIIRS 750m SDR, TC GEO, Cloud Mask IP, Ice Concentration IP, Aerosol Optical Thickness IP, and tunable parameters.

E N D
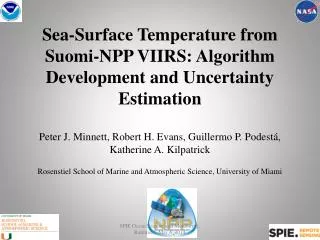
Suomi- NPP VIIRSIce Surface Temperature EDR Status Mark Tschudi (CU)* Yinghui Liu (UWisc), Richard Dworak (UWisc), Dan Baldwin (CU), Robert Mahoney (NG) 2014 STAR JPSS Science Teams Annual Meeting, College Park, MD
VIIRS Ice Surface Temperature IST is the radiating, or "skin", temperature at the ice surface. It includes the aggregate temperature of objects comprising the ice surface, including snow and melt water on the ice. 2014 STAR JPSS Science Teams Annual Meeting, College Park, MD
Summary of the VIIRS IST EDR • The VIIRS Ice Surface Temperature (IST) EDR provides surface temperatures retrieved at VIIRS moderate resolution (750m), for snow/ice covered oceans for both day and night. • The baseline split window algorithm statistical regression method uses two VIIRS Infrared bands, 10.76 μm (M15) and 12.01 μm (M16) for both day and night and is based on the AVHRR heritage IST algorithm (Yu et al., 1995). • Threshold Measurement Uncertainty = 1K Yu,Y., D.A.Rothrock and R.W.Lindsay, 1995, Accuracy of sea ice temperature derived from the Advanced Very High Resolution Radiometer. J. Geophys. Res., 100(C3), 4525-4532 2014 STAR JPSS Science Teams Annual Meeting, College Park, MD
NPPxDRs & IPs Auxiliary Data Output EDRs & IPs VIIRS_ST_04 Ice Surface Temperature Summary of the VIIRS IST EDR Algorithm Inputs VIIRS 750m SDR VIIRS 750m TC GEO VIIRS Cloud Mask IP VIIRS Ice Concentration IP VIIRS Aerosol Optical Thickness IP VIIRS IST Tunable parameters VIIRS IST Regression Coefficient LUT VIIRS Ice Surface Temp. EDR 2014 STAR JPSS Science Teams Annual Meeting, College Park, MD
VIIRS IST EDR and IceBridge Observations of IST • Track of the NASA P-3 aircraft for the March 14, 2012 IceBridge flight. • The P-3 carried a KT-19: a downward-pointing, IR pyrometer that measures the IST • No atmospheric corrections applied • Spot size of 15m Icebridge KT-19 data: Krabill, W. B. and E. Buzay. 2012, updated 2014. IceBridge KT19 IR Surface Temperature.Boulder, Colorado USA: NASA DAAC at the National Snow and Ice Data Center. 2014 STAR JPSS Science Teams Annual Meeting, College Park, MD
VIIRS IST EDR and IceBridge Flight IST NASA's Land PEATE re-processed portions of the VIIRS IST EDR that are co-incident with IceBridge flights over sea ice during March and April 2012. mean VIIRS = -33.2 ˚C mean KT-19 = -33.7 ˚C mean MODIS = -33.4 ˚C BIAS VIIRS-MODIS = +0.2˚C RMS differences: VIIRS - KT-19 = 0.6 ˚C MODIS- KT-19 = 1.2 ˚C VIIRS - MODIS = 1.1 ˚C Comparison between the IST (in deg C) measured by the KT-19 (in black, smoothed over 100 points), the nearest VIIRS IST measurement (in green) and MODIS observation (red). 2014 STAR JPSS Science Teams Annual Meeting, College Park, MD
IceBridge KT19 vs VIIRS IST, Spring 2012 BIAS = VIIRS - KT19 Using data re-processed by NASA Land PEATE, Jan 2013 2014 STAR JPSS Science Teams Annual Meeting, College Park, MD
IST and ST IP Performance for Day Matchups (corrected ST IP coefficients) STIP-KT19 Bias = 0.48C IST EDR-KT19 Bias = 0.47C IST and ST IP performance for day matchups for ST IP computed using the corrected ST IP regression coefficients and reprocessed IST EDR to reflect current IDPS operational coefficients. A 15 minute matchup time window is used. 2014 STAR JPSS Science Teams Annual Meeting, College Park, MD
IceBridge KT-19, March/April 2013 VIIRS IST bias = -0.31 K RMS = 0.87 K Average VIIRS IST: 247.49 K Average KT_19 IST: 247.81 K KT-19 vs VIIRS KT-19 vs VIIRS (BT & IST) vs MODIS 2014 STAR JPSS Science Teams Annual Meeting, College Park, MD
Antarctic, VIIRS vs KT-19 2014 STAR JPSS Science Teams Annual Meeting, College Park, MD
VIIRS IST, MODIS, and NCEP: 2/6/2013 • VIIRS IST has a 0.5-2 K cold bias relative to the MODIS Ice Surface Temperature product. • Bias for VIIRS Land Surface Temperature vs MODIS over the ice sheet (not shown) is still cold but less than the sea ice IST. • Comparisons to NCEP and IABP buoy air temperatures show a similar spatial pattern but yield a VIIRS warm bias of 1 K or more VIIRS BT(11) VIIRS IST MODIS IST NCEP Ts 2014 STAR JPSS Science Teams Annual Meeting, College Park, MD
MODIS/VIIRS IST comparison June 8, 2012 Bias (VIIRS-MODIS) = -0.181 K (VIIRS cold bias) Variance: 1.086 K 2014 STAR JPSS Science Teams Annual Meeting, College Park, MD
VIIRS IST vs MODIS IST VIIRS is biased low (too cold) relative to MODIS, though the bias is relatively small for most of the temperature range. Of greater concern is the uncertainty, which is large at higher temperatures. Histogram of ice surface temperature differences of NPP VIIRS and MODIS (Aqua and Terra) in February 2013 in the Arctic for all cases (upper left), and for cases with MODIS ice surface temperature in the ranges 230-240 K, 240-250 K, 250-260 K, 260-270 K, and 270-273 K. Measurement bias and uncertainty are indicated for each bin. 2014 STAR JPSS Science Teams Annual Meeting, College Park, MD
NCEP NH comparison NCEP vs. VIIRS IST, Feb 27, 2012. Spatial patterns are similar. 2014 STAR JPSS Science Teams Annual Meeting, College Park, MD
Global comparison to NCEP • VIIRS is biased high (warm) compared to NCEP reanalysis. • Note that the NCEP skin temperature used in this analysis is a forecast, not an analysis • Also note that the spatial resolution difference of NCEP and VIIRS is significant • This result is the opposite of the MODIS & IceBridge results. 2014 STAR JPSS Science Teams Annual Meeting, College Park, MD
VIIRS IST EDR Conclusions • VIIRS IST EDR in several but not all cases meets the requirement of 1K measurement uncertainty • VIIRS IST EDR shows a cold bias compared to MODIS and to several IceBridge KT-19 measurements, typically <1K but higher for some comparisons • Some issues, such as higher uncertainty for warmer temperatures, have been uncovered during validation and solutions are being evaluated. • Improvements in IST EDR performance have been realized as the VIIRS Cloud Mask IP matures • More IST improvement is expected as additional quality flags become available in the VIIRS Ice Concentration IP to avoid IST retrievals near clouds. 2014 STAR JPSS Science Teams Annual Meeting, College Park, MD
Future Plans and Issues • No code changes currently planned • Update IST regression coefficients based on matchup with MODIS and airborne/other IST sources • Improvements anticipated with continued upgrades to the VIIRS cloud mask • Additional quality checks in the VIIRS Ice Concentration IP (e.g. for cloud shadowing) will be passed to the IST IP & EDR 2014 STAR JPSS Science Teams Annual Meeting, College Park, MD