Download
1 / 1
10 likes | 103 Views
Global soil moisture analysis at DWD. Introduction. Long term experiment. Evaporation from plants is described in a derived form of the penman combination formula:

E N D
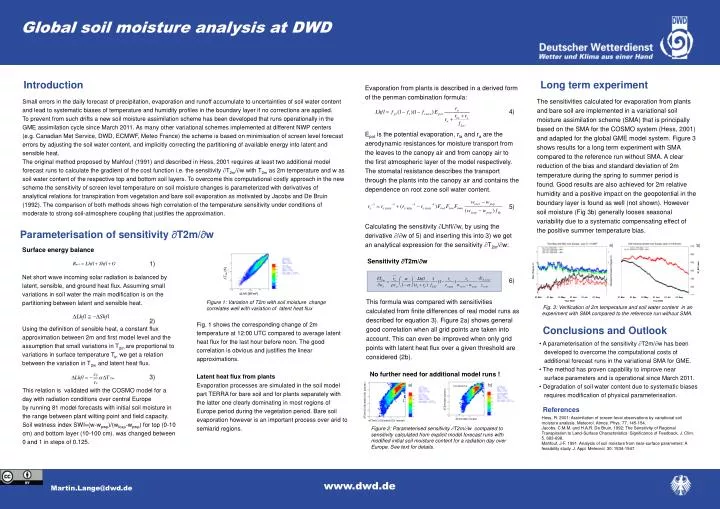
Global soil moisture analysis at DWD Introduction Long term experiment Evaporation from plants is described in a derived form of the penman combination formula: Epot is the potential evaporation, rla and ra are the aerodynamic resistances for moisture transport from the leaves to the canopy air and from canopy air to the first atmospheric layer of the model respectively. The stomatal resistance describes the transport through the plants into the canopy air and contains the dependence on root zone soil water content. Calculating the sensitivity Lhfl/w, by using the derivative /w of 5) and inserting this into 3) we get an analytical expression for the sensitivity T2m/w: The sensitivities calculated for evaporation from plants and bare soil are implemented in a variational soil moisture assimilation scheme (SMA) that is principally based on the SMA for the COSMO system (Hess, 2001) and adapted for the global GME model system. Figure 3 shows results for a long term experiment with SMA compared to the reference run without SMA. A clear reduction of the bias and standard deviation of 2m temperature during the spring to summer period is found. Good results are also achieved for 2m relative humidity and a positive impact on the geopotential in the boundary layer is found as well (not shown). However soil moisture (Fig 3b) generally looses seasonal variability due to a systematic compensating effect of the positive summer temperature bias. Small errors in the daily forecast of precipitation, evaporation and runoff accumulate to uncertainties of soil water content and lead to systematic biases of temperature and humidity profiles in the boundary layer if no corrections are applied. To prevent from such drifts a new soil moisture assimilation scheme has been developed that runs operationally in the GME assimilation cycle since March 2011. As many other variational schemes implemented at different NWP centers (e.g. Canadian Met Service, DWD, ECMWF, Meteo France) the scheme is based on minimisation of screen level forecast errors by adjusting the soil water content, and implicitly correcting the partitioning of available energy into latent and sensible heat. The original method proposed by Mahfouf (1991) and described in Hess, 2001 requires at least two additional model forecast runs to calculate the gradient of the cost function i.e. the sensitivity T2m/w with T2m as 2m temperature and w as soil water content of the respective top and bottom soil layers. To overcome this computational costly approach in the new scheme the sensitivity of screen level temperature on soil moisture changes is parameterized with derivatives of analytical relations for transpiration from vegetation and bare soil evaporation as motivated by Jacobs and De Bruin (1992). The comparison of both methods shows high correlation of the temperature sensitivity under conditions of moderate to strong soil-atmosphere coupling that justifies the approximation. 4) 5) Parameterisation of sensitivity T2m/w a) b) Surface energy balance Net short wave incoming solar radiation is balanced by latent, sensible, and ground heat flux. Assuming small variations in soil water the main modification is on the partitioning between latent and sensible heat. Using the definition of sensible heat, a constant flux approximation between 2m and first model level and the assumption that small variations in T2m are proportional to variations in surface temperature Ts, we get a relation between the variation in T2m and latent heat flux. Sensitivity T2m/w 1) W_SO (mm) T2m (K) 6) Lhfl (W/m2) 01 Mar 01 Apr 01 May 01 Jun 01 Jul 01 Aug 01 Mar 01 Apr 01 May 01 Jun 01 Jul 01 Aug This formula was compared with sensitivities calculated from finite differences of real model runs as described for equation 3). Figure 2a) shows general good correlation when all grid points are taken into account. This can even be improved when only grid points with latent heat flux over a given threshold are considered (2b). Figure 1: Variation of T2m with soil moisture change correlates well with variation of latent heat flux Year 2009 Year 2009 Fig. 3: Verification of 2m temperature and soil water content in an experiment with SMA compared to the reference run without SMA. 2) Fig. 1 shows the corresponding change of 2m temperature at 12:00 UTC compared to average latent heat flux for the last hour before noon. The good correlation is obvious and justifies the linear approximations. Latent heat flux from plants Evaporation processes are simulated in the soil model part TERRA for bare soil and for plants separately with the latter one clearly dominating in most regions of Europe period during the vegetation period. Bare soil evaporation however is an important process over arid to semiarid regions. Conclusions and Outlook • A parameterisation of the sensitivity T2m/w has been developed to overcome the computational costs of additional forecast runs in the variational SMA for GME. • The method has proven capability to improve near surface parameters and is operational since March 2011. • Degradation of soil water content due to systematic biases requires modification of physical parameterisation. No further need for additional model runs ! 3) a) b) Lhfl<200W/m2 This relation is validated with the COSMO model for a day with radiation conditions over central Europe by running 81 model forecasts with initial soil moisture in the range between plant wilting point and field capacity. Soil wetness index SWI=(w-wpwp)/(wfcap-wpwp) for top (0-10 cm) and bottom layer (10-100 cm). was changed between 0 and 1 in steps of 0.125. dT2m/dwb (param.) dT2m(12:00)/dwb(0:00) (param.) References Hess, R. 2001: Assimilation of screen-level observations by variational soil moisture analysis. Meteorol. Atmos. Phys. 77, 145-154. Jacobs, C.M.M. and H.A.R. De Bruin, 1992: The Sensitivity of Regional Transpiration to Land-Surface Characteristics: Significance of Feedback. J. Clim. 5, 683-698. Mahfouf, J-F. 1991. Analysis of soil moisture from near-surface parameters: A feasibility study. J. Appl. Meteorol. 30: 1534-1547. dT2m/dwb (model) dT2m(12:00)/dwb(0:00) (model) Figure 2: Parameterised sensitivity T2m/w compared to sensitivity calculated from explicit model forecast runs with modified initial soil moisture content for a radiation day over Europe. See text for details. www.dwd.de Martin.Lange@dwd.de