Download
1 / 1
10 likes | 103 Views
TRENDS OF DRY SPELLS IN EUROPE (1951-2000). C. SERRA (1) , M.D. MARTÍNEZ (2) , X. LANA (1) and A. BURGUEÑO (3). (1) Dept. Física i Enginyeria Nuclear, Universitat Politècnica de Catalunya, Av. Diagonal, 647, 08028 Barcelona, Spain (francisco.javier.lana@upc.edu, carina.serra@upc.edu)

E N D
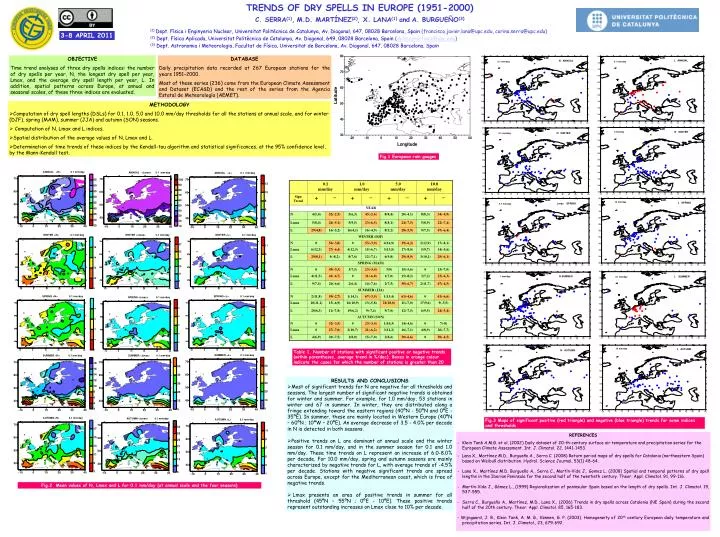
TRENDS OF DRY SPELLS IN EUROPE (1951-2000) C. SERRA(1),M.D. MARTÍNEZ(2), X. LANA(1) andA. BURGUEÑO(3) (1) Dept. Física i Enginyeria Nuclear, Universitat Politècnica de Catalunya, Av. Diagonal, 647, 08028 Barcelona, Spain (francisco.javier.lana@upc.edu, carina.serra@upc.edu) (2)Dept. Física Aplicada, Universitat Politècnica de Catalunya, Av. Diagonal, 649, 08028 Barcelona, Spain (dolors.martinez@upc.edu) (3) Dept. Astronomia i Meteorologia, Facultat de Física, Universitat de Barcelona, Av. Diagonal, 647, 08028 Barcelona, Spain 3-8 APRIL 2011 OBJECTIVE Time trend analyses of three dry spells indices: the number of dry spells per year, N, the longest dry spell per year, Lmax, and the average dry spell length per year, L. In addition, spatial patterns across Europe, at annual and seasonal scales, of these three indices are evaluated. DATABASE Daily precipitation data recorded at 267 European stations for the years 1951–2000. Most of these series (236) come from the European Climate Assessment and Dataset (ECA&D) and the rest of the series from the Agencia Estatal de Meteorología (AEMET). • METHODOLOGY • Computation of dry spell lengths (DSLs) for 0.1, 1.0, 5.0 and 10.0 mm/day thresholds for all the stations at annual scale, and for winter (DJF), spring (MAM), summer (JJA) and autumn (SON) seasons. • Computation of N, Lmax and L indices. • Spatial distribution of the average values of N, Lmax and L. • Determination of time trends of these indices by the Kendall-tau algorithm and statistical significances, at the 95% confidence level, by the Mann-Kendall test. Fig.1 European rain gauges Table 1. Number of stations with significant positive or negative trends (within parentheses, average trend in %/dec). Boxes in orange colour indicate the cases for which the number of stations is greater than 20 • RESULTS AND CONCLUSIONS • Most of significant trends for N are negative for all thresholds and seasons. The largest number of significant negative trends is obtained for winter and summer. For example, for 1.0 mm/day, 53 stations in winter and 67 in summer. In winter, they are distributed along a fringe extending toward the eastern regions (40ºN - 50ºN and 0ºE - 35ºE). In summer, these are mainly located in Western Europe (40ºN – 60ºN ; 10ºW – 20ºE). An average decrease of 3.5 - 4.0% per decade in N is detected in both seasons. • Positive trends on L are dominant at annual scale and the winter season for 0.1 mm/day, and in the summer season for 0.1 and 1.0 mm/day. These time trends on L represent an increase of 6.0-8.0% per decade. For 10.0 mm/day, spring and autumn seasons are mainly characterized by negative trends for L, with average trends of -4.5% per decade. Stations with negative significant trends are spread across Europe, except for the Mediterranean coast, which is free of negative trends. • Lmax presents an area of positive trends in summer for all threshold (45ºN – 55ºN ; 0ºE - 10ºE). These positive trends represent outstanding increases on Lmax close to 10% per decade. Fig.3 Maps of significant positive (red triangle) and negative (blue triangle) trends for some indices and thresholds • REFERENCES • Klein Tank A.M.G. et al. (2002) Daily dataset of 20-th-century surface air temperature and precipitation series for the European Climate Assessment. Int. J. Climatol. 22, 1441-1453. • - Lana X., Martínez M.D., Burgueño A., Serra C. (2008) Return period maps of dry spells for Catalonia (northeastern Spain) based on Weibull distribution. Hydrol. Science Journal, 53(1) 48-64. • - Lana X., Martínez M.D. Burgueño A., Serra C., Martín-Vide J., Gomez L. (2008) Spatial and temporal patterns of dry spell lengths in the Iberian Peninsula for the second half of the twentieth century. Theor. Appl. Climatol. 91, 99-116. • Martín-Vide J., Gómez L., (1999) Regionalization of peninsular Spain based on the length of dry spells. Int. J. Climatol. 19, 537-555. • Serra C., Burgueño A., Martínez, M.D., Lana X., (2006) Trends in dry spells across Catalonia (NE Spain) during the second half of the 20th century. Theor. Appl. Climatol. 85, 165-183. - Wijngaard, J. B., Klein Tank, A. M. G., Können, G. P. (2003). Homogeneity of 20th century European daily temperature and precipitation series. Int. J. Climatol., 23, 679-692. Fig.2 Mean values of N, Lmax and L for 0.1 mm/day (at annual scale and the four seasons)