Download

1 / 32
320 likes | 451 Views
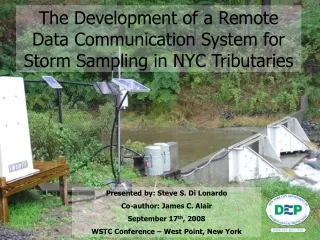
The Development of a Remote Data Communication System for Storm Sampling in NYC Tributaries. Presented by: Steve S. Di Lonardo Co-author: James C. Alair September 17 th , 2008 WSTC Conference – West Point, New York. Introduction. Storm setup & sample collection

E N D
The Development of a Remote Data Communication System for Storm Sampling in NYC Tributaries Presented by: Steve S. Di Lonardo Co-author: James C. Alair September 17th, 2008 WSTC Conference – West Point, New York
Introduction • Storm setup & sample collection • Sample processing using the data acquisition software • Data analysis & quality control • Future direction
Field Setup & Sample Collection Challenges • Large sample effort • Short event duration • Distance between sample sites • Adverse field conditions
Auto-Sampler Field Setup ← solarpanel ← housing for Campbell data-logger DEP monitors stream discharge at Kensico streams ←ISCO auto-sampler ←sampler uptake line
Sampling Components Intake lines + staff gauge + pressure transducer Campbell data logger + ISCO trigger 1 L Bottles ISCO auto-sampler
Storm Sampling • After the storm, field staff collects samples at each site to be composited based on where samples were obtained along the hydrograph…
Storm Sampling 2005-2007 • Prior to the development of remote site connections via modems, data acquisition required on-site PDA downloads • Upon return • data was imported into a spreadsheet • data manager was required to convert data to create hydrograph
Storm Sampling 2008 • DEP installed modems at each site for remote communication and real-time data acquisition • WISKI provides access to data in a user-friendly format to accelerate creation of hydrographs and make decisions
Click “connect” Select site & connect Click “Ports and Flags” to set trigger Set Flag 4 “High”
Storm Setup Remote connection via modem to Campbell data-logger using the LoggerNet program allows for checking gage station data * * * * *
Storage and Management of Data • WISKI - Water Resources Information System KISTERS • provides a user-friendly access port for gage station data • data management capabilities • facilitates data access in many forms… • Graphs • Tables • Reports
WISKI generates a data report to facilitate the creation of a storm hydrograph
Storm Sampling • Samples were “split” based on hydrological phases (i.e., rising, peak, descending) • Ideally, each phase would have equal representation (equal volume - sample effort) • This is achieved by having prior knowledge of hydrological conditions at each stream site & determining sample interval and duration accordingly
Storm Hydrograph “peak” “descending limb” “rising limb”
USGS Gage Sites • In addition to DEP managed stream gage sites around Kensico, WISKI will import flow data from all other flow gages in the NYC Watershed • Achieved through the use of ADAPS software which collects adjusted flow data from USGS
ADAPS • ADAPS – Automated Data Processing System • Developed for the processing, storage, and retrieval of water data (USGS) • Part of National Water Information System (NWIS) • Designed to work interactively with multiple users
Data access for WISKI users… Click sub-watershed Interactive watershed maps
Sub-Watershed Click Gage Stations
Data analysis tool • Specify dates, parameters • Output format (i.e. graph,report)
Field Quality Assurance • DEP field staff performs monthly stream gage site maintenance to assure measured staff height is correct • Check stream rating curves on a scheduled basis • Changes would be recorded and submitted to data manager
Data comment form • Data manager enters comments • data is automatically tagged w/comment attached
WISKI stores rating curve information… • Adjustment in rating curve automatically adjusts flow data
WISKI can be used as a tool for data analysis and reporting….
Example…. • Annual Water Report • Useful for water budgets • Mass balance calculations
Future Direction • WISKI can be used as a sentinel tool • Data alarm notifies manager if a parameter falls out of a specified range (i.e., flow spike on a sunny day can warn of a sewage spill)
Future Direction • Incorporation of other parameters of interest • Continuous on-site measurements (i.e. turbidity, toxins, weather) • Import of discrete lab measurements from LIMS or SAS (i.e. microbiological, chemistry) HUGE POTENTIAL!
Acknowledgements • Water Resource Development Act (WRDA) - USACE • Safe Drinking Water Act (SDWA) - USEPA • NYC Department of Environmental Protection (NYC DEP) • Kisters North America • WWQO Field Group • David Lounsbury • Christian Pace • Kerri Alderisio • Lorraine Janus • Steve Schindler • Sharon Neuman