Download
1 / 48
480 likes | 557 Views
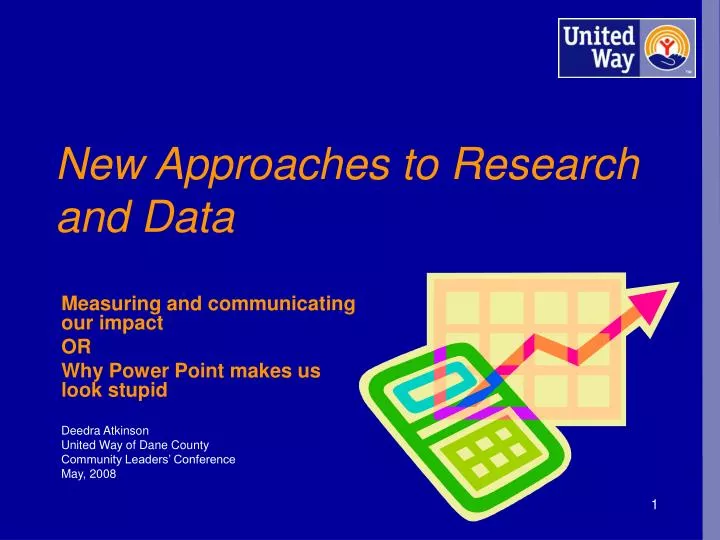
New Approaches to Research and Data. Measuring and communicating our impact OR Why Power Point makes us look stupid Deedra Atkinson United Way of Dane County Community Leaders’ Conference May, 2008. Today’s objectives. Building creditability as a community partner through data

E N D
New Approaches to Research and Data Measuring and communicating our impact OR Why Power Point makes us look stupid Deedra Atkinson United Way of Dane County Community Leaders’ Conference May, 2008
Today’s objectives • Building creditability as a community partner through data • Generate new sources and partnerships for finding data • Ideas and techniques for displaying and communicating data • Sources, models and ideas for using data
Dane County Snapshot Population: 225,000 in Madison and 450,000 in all of Dane County Consistently low unemployment rate Always listed on “Top 10 Best Places to Live” 15% of population persons of color (42% in Madison Metropolitan Schools) 3
Aspirational and realistic 2008 Investments $14,000,000!
Strategy for change focuses resources • Accountability to the donor • Engage us in a common vision • Create change at the community level • Identify strategies that get results • Use data, research and best practices
Reducing the racial achievement gap WISCONSIN READING COMPREHENSION TEST 1991-2004 BELOW STANDARD/MINIMAL PERFORMANCE BY ETHNIC GROUP First Year Schools of Hope Leadership Team Source: MMSD student data warehouse summary tables. All figures are based on students participating in test.
Power Point is intellectually thin • Hierarchical, bullet outlines dilute thought • Data-thin, forgetful displays make audiences passive and diminish credibility of presenter • Sets up a dominance relationship • Auto wizard dilutes ability to gain wisdom from data
Children and Youth Achieve PotentialReadiness to Succeed in School
Children and Youth Achieve PotentialEducational Success and Readiness to Succeed in Adulthood
Children and Youth Achieve PotentialEducational Success and Readiness to Succeed in Adulthood
Children and Youth Achieve PotentialEducational Success and Readiness to Succeed in Adulthood
Families are Economically Stable and IndependentFinancial Stability Among Working Families
Reason for Not Giving to United Way This Year (Lapsed Donors) Over half the reasons for not giving (53%) focus on the lack of reach/contact with United Way or WP campaign Base = 111
Recent National History: Katrina Affects Percentage -1.2 pct point change 0.7 pct point change 0.5 pct point change -0.1 pct point change % National Designation Percent Fell Beginning 2004 Source: UWA Research
Areas of Growth and Decline in the Continuum • Annual Campaign $3.61B to $3.63B • Government Grants $134M to $151M • Gifts to Initiatives $84M to $102M • Corporate Sponsorships $4.3M to $6.0M • Volunteer Time $161M to $165M • Planned Giving (EPG) $62M to $67M • Major Gifts (non campaign) $4.7M to $24M • UW1 Discretionary Funds $2.71B to $2.69B • Leveraged Funds $225M to $221M National Drop in Unrestricted Real Dollars Source: UWA Research
Key Club Givers Key Club consistent with Tocqueville Society
Leadership Giving: Potential Reasons • Recruiting to Tocqueville Society often focused on existing philanthropy through United Way • Meets donor desire to show support of United Way without significant increase in overall philanthropy • National trend is for donors to give specifically so they know where dollars are going • Opportunity for greater emphasis on importance of unrestricted giving
Local Trends Total Private Sector Unrestricted % Flattening?
Local Donor Retention Actual 2-year retention 2006 to 2007 = 91%
2006 Churn Rates: Metro 1 Percent UWs losing 1 out of every 2 donors Max: 45% Churn Rate UWs losing 1 out of every 3 donors 31% Churn Rate UWs losing 1 out of every 5 donors Average: 21% 7% Churn Rate Twenty-five percent (25%) of Metro 1 UWs lose between 1 out of 2 to 1 out of 3 donors Source: UWA Research, 2006-07 Database 2 Survey
UWs w/Year-Round Relationships Among More Donors have Lower “Churn” Rates Churn Rate % UWs w/Yr Round Relationships Among % of Donors:
Data should engage and tell a story • Data walls, not projected presentation • Headline and conclusion, not label • Use color • Sources • Pay attention to the message you’re sending • Combine data elements to contextualize
Presentations should be good teaching • Eliminate hierarchical bulleted lists • Danger: paralysis by analysis • Use techniques to prompt discussion Wisdom Data Knowledge Data Information
Data builds accountability, credibility, and trust • Use community data • The internet is your friend • Seek new data partners • Capture scope and dimension • May take years….and then you’ll refine it some more
Data is not always reliable or timely - changes can impact the work we do. • SOH – change in the 3rd grade reading test • School district changes definition of homeless children • Department of Corrections changed definition of recidivism
An effective accountability system will create impact Resources support effective work, practice, research Community allocates resources Research informs practice Evidence informs community Practice provides evidence
Students of color achieve at the same rate as white students. 2004 - 3rd grade reading --gap eliminated in MMSD 10th grade algebra—in process in MMSD Sun Prairie in 2nd year for elementary literacy; 1st year for middle school math Verona in 1st year for elementary literacy Source: Madison Metropolitan School District
Fewer children have the skills they need to start school. * Screening tool changed in 2002 Source: Madison Metropolitan School District
Top mental health issues are consistent across levels 259 567 178 206 191 387 395 325 313 378 538 446 412 Source: MMSD data, first semester 05/06
There is a decrease in homelessness. Homeless children in Madison Children in shelter Number of children Source: Madison Metropolitan School District
Surplus food distributed through pantries and meal sites + 50% in 3 years. Sources: Community Action Coalition reports, Second Harvest Food Bank reports
Who Needed the Model? Community Alignment Project Solution Case Managers Caregivers Care-receivers Donors CST Limited accessibility to available resources Limited service information for the clients Need to quickly understand the impact from their investment Needed uniform structure and language for investment decision 40
Seniors are supported in their homes Since 2001, less than 4% of seniors in Dane County are in skilled nursing facilities Sources: US Census, Dane County Public Health Profiles, State of WI Dept of Health & Family Services, WSJ 2007 Book of Buisness
17% 23% 32% 28% 42
Non-profit agencies and volunteers are strong partners in achieving measurable results. 79.5 80 78* 71.5 66.7 57.5 51.6 41.9 27.6 24.2 Survey of Agencies, June 2005, 54 responses *Completed UWDC Best Practices Tool, National Tool, or another recognized tool 2005 Agency Year-end Reports 2006 Agency Year-end Reports
UWDC Days of Caring links volunteers and agencies Volunteer Participation Agency Participation 219 2174 2127 2207 2071 139 Days of Caring is a three day volunteer event which links volunteers and agencies. 107 86 70 79 145 129 123 143 Source: Volunteer Solutions / VolunteerYourTime.org
73% think United Way of Dane County creates long term impact
Your presentation of data is dependent on the quality, relevance, and integrity of content • Designer format doesn’t salvage weak content • Audience boredom is a content failure, not a decoration failure • Don’t get taken in by Phluff tools