Download
1 / 1
20 likes | 115 Views
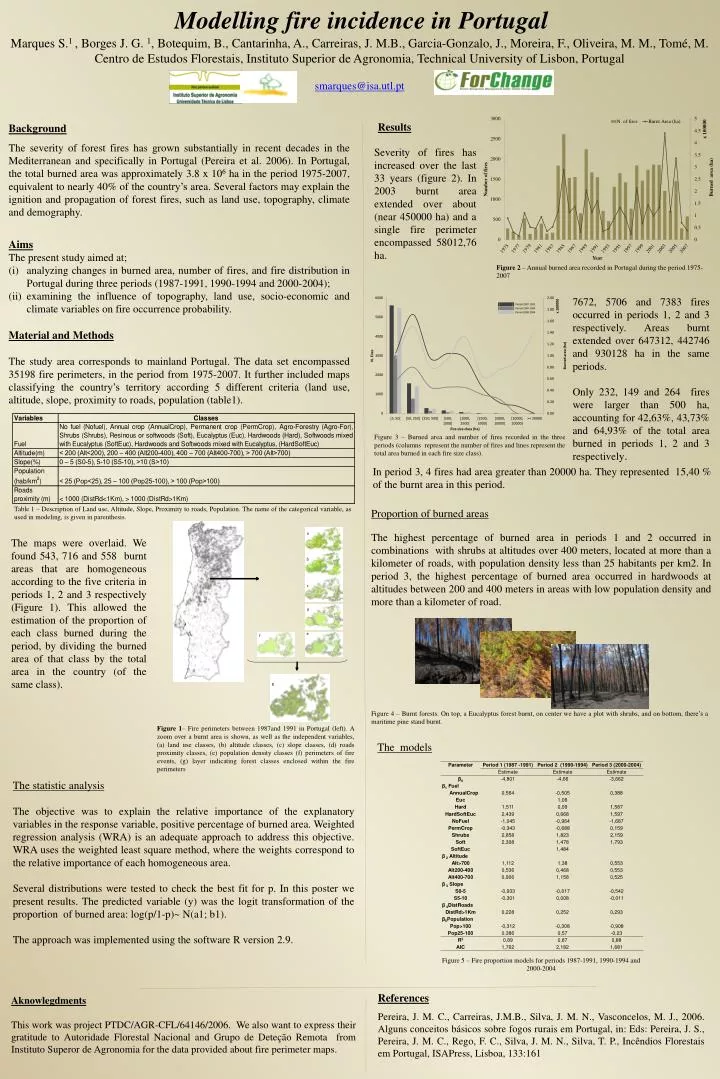
Modelling fire incidence in Portugal. Marques S. 1 , Borges J. G. 1 , Botequim, B., Cantarinha, A., Carreiras, J. M.B., Garcia-Gonzalo, J., Moreira, F., Oliveira, M. M., Tomé, M. Centro de Estudos Florestais, Instituto Superior de Agronomia, Technical University of Lisbon, Portugal

E N D
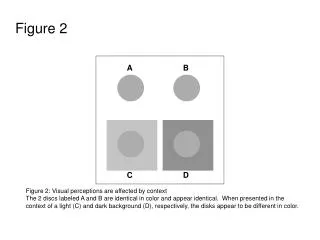
Modelling fire incidence in Portugal Marques S.1 , Borges J. G. 1, Botequim, B., Cantarinha, A., Carreiras, J. M.B., Garcia-Gonzalo, J., Moreira, F., Oliveira, M. M., Tomé, M. Centro de Estudos Florestais, Instituto Superior de Agronomia, Technical University of Lisbon, Portugal smarques@isa.utl.pt Results • Background • The severity of forest fires has grown substantially in recent decades in the Mediterranean and specifically in Portugal (Pereira et al. 2006). In Portugal, the total burned area was approximately 3.8 x 10⁶ ha in the period 1975-2007, equivalent to nearly 40% of the country’s area. Several factors may explain the ignition and propagation of forest fires, such as land use, topography, climate and demography. • Aims • The present study aimed at; • analyzing changes in burned area, number of fires, and fire distribution in Portugal during three periods (1987-1991, 1990-1994 and 2000-2004); • examining the influence of topography, land use, socio-economic and climate variables on fire occurrence probability. • Material and Methods • The study area corresponds to mainland Portugal. The data set encompassed 35198 fire perimeters, in the period from 1975-2007. It further included maps classifying the country’s territory according 5 different criteria (land use, altitude, slope, proximity to roads, population (table1). Severity of fires has increased over the last 33 years (figure 2). In 2003 burnt area extended over about (near 450000 ha) and a single fire perimeter encompassed 58012,76 ha. Figure 2 – Annual burned area recorded in Portugal during the period 1975-2007 7672, 5706 and 7383 fires occurred in periods 1, 2 and 3 respectively. Areas burnt extended over 647312, 442746 and 930128 ha in the same periods. Only 232, 149 and 264 fires were larger than 500 ha, accounting for 42,63%, 43,73% and 64,93% of the total area burned in periods 1, 2 and 3 respectively. Figure 3 – Burned area and number of fires recorded in the three periods (columns represent the number of fires and lines represent the total area burned in each fire size class). In period 3, 4 fires had area greater than 20000 ha. They represented 15,40 % of the burnt area in this period. Table 1 – Description of Land use, Altitude, Slope, Proximity to roads, Population. The name of the categorical variable, as used in modeling, is given in parenthesis. Proportion of burned areas The highest percentage of burned area in periods 1 and 2 occurred in combinations with shrubs at altitudes over 400 meters, located at more than a kilometer of roads, with population density less than 25 habitants per km2. In period 3, the highest percentage of burned area occurred in hardwoods at altitudes between 200 and 400 meters in areas with low population density and more than a kilometer of road. The maps were overlaid. We found 543, 716 and 558 burnt areas that are homogeneous according to the five criteria in periods 1, 2 and 3 respectively (Figure 1). This allowed the estimation of the proportion of each class burned during the period, by dividing the burned area of that class by the total area in the country (of the same class). Figure 4 – Burnt forests. On top, a Eucalyptus forest burnt, on center we have a plot with shrubs, and on bottom, there’s a maritime pine stand burnt. Figure 1– Fire perimeters between 1987and 1991 in Portugal (left). A zoom over a burnt area is shown, as well as the independent variables, (a) land use classes, (b) altitude classes, (c) slope classes, (d) roads proximity classes, (e) population density classes (f) perimeters of fire events, (g) layer indicating forest classes enclosed within the fire perimeters The models The statistic analysis The objective was to explain the relative importance of the explanatory variables in the response variable, positive percentage of burned area. Weighted regression analysis (WRA) is an adequate approach to address this objective. WRA uses the weighted least square method, where the weights correspond to the relative importance of each homogeneous area. Several distributions were tested to check the best fit for p. In this poster we present results. The predicted variable (y) was the logit transformation of the proportion of burned area: log(p/1-p)~ N(a1; b1). The approach was implemented using the software R version 2.9. Figure 5 – Fire proportion models for periods 1987-1991, 1990-1994 and 2000-2004 References Pereira, J. M. C., Carreiras, J.M.B., Silva, J. M. N., Vasconcelos, M. J., 2006. Alguns conceitos básicos sobre fogos rurais em Portugal, in: Eds: Pereira, J. S., Pereira, J. M. C., Rego, F. C., Silva, J. M. N., Silva, T. P., Incêndios Florestais em Portugal, ISAPress, Lisboa, 133:161 Aknowlegdments This work was project PTDC/AGR-CFL/64146/2006. We also want to express their gratitude to Autoridade Florestal Nacional and Grupo de Deteção Remota from Instituto Superor de Agronomia for the data provided about fire perimeter maps.