Download
1 / 16
160 likes | 246 Views
Composition and spectral properties of the 1 AU quiet-time suprathermal ion population during solar cycle23 M Al-Dayeh, M I Desai, J R Dwyer, H K Rassoul, G M Mason, and J E Mazur submitted to ApJ Sept 2008.

E N D
Composition and spectral properties of the 1 AU quiet-time suprathermal ion population during solar cycle23 M Al-Dayeh, M I Desai, J R Dwyer, H K Rassoul, G M Mason, and J E Mazur submitted to ApJ Sept 2008
AbstractWe have surveyed the spectral and compositional properties of suprathermal heavy ions during quiet times from 1995 January 1 to 2007 December 31 using Wind/STEP and ACE/ULEIS at energies between 0.04 and 2.56 MeV nucleon-1. We find that: Quiet-time Fe/O and C/O abundances are correlated with solar cycle activity, reflecting corresponding values measured in solar energetic particle (SEP) and interplanetary (IP) shock events during solar maximum, and those measured in the solar wind (SW) and corotating interaction regions (CIRs) during solar minimum conditions. The 3He/4He ratio lies in the 3%-8% range during the quiet times of 1998-2004 with an average 3He abundance of ~27.4%. This ratio drops to 0.3%-1.2% during 2005-2007. All heavy ion species exhibit suprathermal tails between 0.04-0.32 MeV nucleon-1 with spectral indices ranging from ~1.27 to 2.29. These tails sometimes extend above ~2 MeV nucleon-1 with Fe spectra rolling over at lower energies than those of CNO. The suprathermal tail spectral indices of heavier species (i.e., Fe) are harder than those of the lighter ones (i.e., CNO). These indices do not exhibit a clear solar cycle dependence and for ~50% of the time, they deviate significantly from the 1.5 value. These compositional observations provide evidence that even during the quietest times in interplanetary space, the suprathermal population (3He and C-through-Fe) consists of ions from different sources whose relative contributions vary with solar activity. The heavy ion energy spectra exhibit suprathermal tails with variable spectral indices that do not exhibit the spectral index of 1.5 predicted by some recent models.
Figure 1. Six-hour running averages of heavy ions (C through Fe) intensity as measured by (a) ACE/ULEIS and (b) Wind/STEP at two different energy ranges; red bars mark the maximum intensity of the quiet times during each year. (c) Monthly-running averages of sunspot numbers from 1995 January 1 through 2007 December 31. Assigned percentages denote the fraction of total hours that are considered quiet. (d) Number of quiet hours during each year as a result of the selection criteria in ULEIS (blue) and STEP (Green). Dashed blue line marks the total number of hours in a year
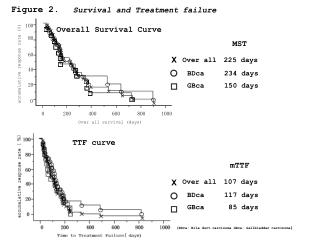
Figure 2. (a) Heavy-ion intensity histogram for all hours as measured by STEP during 2001. Dashed line shows the highest heavy-ion intensity cutoff during the selected quiet times. (b) Distribution of the consecutive quiet hours. (c) to (g): Hourly intensities of different species at different energy ranges (black). Red symbols indicate the quiet-time intensities. Yellow-highlighted regions mark intensities with consecutive quiet hours corresponding to their different occurrences in (b). Green shaded areas are discussed in text.
Figure 4. STEP heavy-ion cumulative intensity during the quiet hours of 2001 and 2007. The smooth increase with increasing quiet hours indicates comparable intensities during all quiet hours.
Figure 5. (a) C/O, (b) Fe/O & Fe/CNO, and (c) 3He/4He ratios as measured by STEP and ULEIS at different energy ranges between 1995 and 2007. On all panels: red plots are those determined by Desai et al. (2006). Horizontal lines represent averaged abundances measured in different heliosphere particle populations: CIRs abundance at ~0.15 MeV nucleon-1 (CIRs: Mason et al. 2008); 3He-rich or impulsive SEP events at ~ 0.375 MeV nucleon-1 (Impulsive SEPs: Mason et al. 2002); gradual SEP events at ~0.38 MeV nucleon-1 (Gradual SEPs: Desai et al. 2006b); CME-driven IP shocks at ~0.75 MeV nucleon-1 (IP Shocks: Desai et al. 2003); fast solar wind (FSW; Glockler & Geiss 2007 ), and slow solar wind (SSW; von Steiger et al. 2000). Horizontal line in panel c shows the average solar wind value (Gloeckler & Geiss 1998)
Figure 6. (a) & (b): Heavy-ion intensity for Bartels rotations 2275 (Days 76-103 of 2000) and 2367 (days 3-30 of 2007) respectively. Intensities during selected quiet hours are plotted in red. (c) & (d): Hourly 3He counts during the quiet hours of the selected Bartels rotations. Red dots correspond to the quiet hours during each of the 27-day periods
Figure 7. (a) Fraction of time with 3He present during the quiet times from 1998 to 2007. Points are shown for individual Bartels rotations; red line shows the running average over 3 rotations. Vertical green arrows indicate rotations with no signatures of 3He and red arrows point to the Bartels rotations shown in Figure 6.
Figure 8. ULEIS (squares) and STEP (circles) integrated energy spectra of heavy ions during the quiet times of (a) 1996 (STEP), (b) 2001, and (c) 2007. Solid lines represent the best fits. All STEP data points are fitted by a power-law and all ULEIS data points are fitted with the Jones & Ellison expression where the spectral index and the e-folding energy are determined (see text for details). Panels (d), (e), & (f): Energy dependence of Fe/CNO during the quiet times of 1996, 2001, and 2007. Horizontal lines: averaged abundances of Fe/CNO in different heliospheric populations (as in Figure 5)
Figure 9. (a) Variations of the quiet-time spectral indices of CNO and Fe as measured by STEP for years 1995 through 2007 at 0.04-0.32 MeV nucleon-1. Highlighted regions mark index values between 1.3 and 1.7. (b) e-folding energy variations of the quiet-time Fe spectra from 1998 to 2007 fitted the JE spectral expression (arrows indicate that the rollover occurred beyond the fitted data range).
Figure 10. Power-law spectral indices of Fe (a) and Ne-S (b) vs. that of CNO as measured by Wind/STEP at 0.04-0.32 MeV nucleon-1 for years 1995 through 2007. Highlighted regions indicate index values between 1.3 and 1.7.