Download
1 / 20
200 likes | 295 Views
Greenhouse Gas Inventory 1990-2003. Sam Hummel Environmental Sustainability Coordinator . Matthew Barkley MEM ’05. Methodology.

E N D
Greenhouse Gas Inventory1990-2003 Sam Hummel Environmental Sustainability Coordinator Matthew BarkleyMEM ’05 Greenhouse Gas Inventory - Duke University
Methodology • The inventory was performed during the summer of 2004 using software distributed by Clean-Air Cool-Planet, a non-profit organization out of Portsmouth, NH. (www.cleanair-coolplanet.org/) • The goals of the inventory were to determine how much greenhouse gas (GHG) emissions Duke is responsible for today, characterize the major sources and examine trends in emissions over the last 14 years. These pieces of information will be instrumental in forming any action plan for reducing Duke’s emissions. • The inventory includes all campus operations, meaning it includes the medical center as well as the University. The decision to put the two together was driven by the difficulty in parsing energy, waste and transportation expenditures between the two entities that share a common campus. Greenhouse Gas Inventory - Duke University
Why 1990 to 2003? • The motivation for beginning the inventory in 1990 came from the Kyoto Protocol, which has become the primary benchmark for environmental stewardship with regards to global climate change. • The Protocol is an international treaty negotiated in 1997 that calls on industrialized nations to decrease their emissions of six greenhouse gases…carbon dioxide, methane, nitrous oxide, sulfur hexafluoride, HFCs and PFCs. • The protocol sets national reduction targets which range from 8% reductions below 1990 levelsfor the European Union to 7% for the US, 6% for Japan, 0% for Russia, and permitted increases of 8% for Australia and 10% for Iceland. • The United States has not ratified the Kyoto Protocol treaty and is therefore not legally bound to meet the Kyoto reduction target. However, institutions, and municipalities within the US have made commitments to reduce their own emissions in accordance with the Kyoto goal. • Cornell University, Lewis & Clark University, College of the Atlantic have all made a commitment to meeting the Kyoto Protocol. Greenhouse Gas Inventory - Duke University
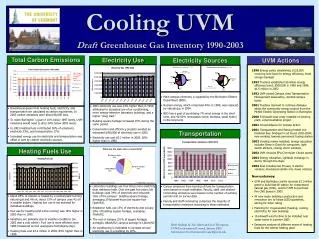
Transportation Fleet vehicles Employee commuter trips Athletic team travel (incomplete) Purchased Electricity Duke Power The GHG emissions factor used was reported by the Southeastern Electric Reliability Council (SERC). The SERC region is made of Virginia and the Carolina’s. Power plants in SERC are responsible for 21% of the GHG emissions emitted by power plants in the US every year. Steam Plant Coal, Fuel Oil, Natural Gas Refrigerants (negligible) PFCs, HFCs, SF6 Solid Waste (negligible) Incinerated, Landfill gases Offsets (negligible) Duke Forest preservation Composting Sources of GHG Emissions Inventoried Greenhouse Gas Inventory - Duke University
All results are reported in carbon dioxide equivalents (eCO2). This is necessary in order to compare the global warming effect of the six greenhouse gases because each of them have very different heat trapping potentials. Measurements of non-carbon-dioxide greenhouse gases were converted into CO2 equivalents (eCO2) based on their relative heat trapping potential. As can be seen in the table at right, carbon dioxide actually has the lowest global warming potential of the six gases measured. (However, CO2 makes up a majority of the emissions.) Carbon Dioxide Equivalency (eCO2) Greenhouse Gas Inventory - Duke University
Duke’s GHG emissions (1990-2003) In 2003, Duke’s emissions were 31% above its 1990 emissions, and 36% above the goal of 7% below 1990 established by the Kyoto Protocol. 36% Kyoto Goal 64% Greenhouse Gas Inventory - Duke University
Duke’s GHG Emissions: Contributions by Source Transportation 22% Steam Plant 25% Purchased Electricity 53% Greenhouse Gas Inventory - Duke University
Source Details: Purchased Electricity • Duke’s electricity purchase was responsible for 53% of the university’s GHG emissions in 2003. • Duke used 375,903 MWh generated by Duke Power. • The generation of Duke’s 2003 electricity purchase produced 198,639 metric tonnes of eCO2 emissions. • That is equivalent to the average emissions of 43,792 cars in a year. • Or, it is the amount absorbed in a year by 59,732 acres of mature trees. Greenhouse Gas Inventory - Duke University
Source Details: Steam Generation • Duke’s steam plant was responsible for 25% of the university’s GHG emissions in 2003. • The generation of Duke’s steam produced 93,019 metric tonnes of eCO2 emissions. • That is equivalent to the average emissions of 20,507 cars in a year. • Or, it is the amount absorbed in a year by 27,972 acres of mature trees. Greenhouse Gas Inventory - Duke University
Source Details: Transportation • Transportation was responsible for 22% of the university’s GHG emissions in 2003. • The inventory measured emissions from Duke’s fleet vehicles, employee commuter trips and athletic team travel. • The emissions from Duke’s transportation related activities in 2003 produced 88,495 metric tonnes of eCO2. • That is equivalent to the average emissions of 19,510 cars in a year. • Or, it is the amount absorbed in a year by 26,611 acres of mature trees. • Note: An undetermined amount of transportation related emissions have fallen under the steam plant and purchased electricity totals in the inventory. This is because natural gas purchased for use in Facilities Management’s compressed natural gas (CNG) vehicles was not separated out from that purchased for use in the steam plant. This is also true for the energy used in any electric vehicles, including John Deere Gators and golf carts. Greenhouse Gas Inventory - Duke University
Source Details: Transportation Incomplete Data • The pre-1999 fleet fuel usage is likely overestimated in the inventory. This is because exact data was not available for 1990 to 1999. • There was a rapidly increasing trend in both diesel and gasoline fuel usage from 1999 to 2003. If that rate were used in regression analysis to estimate 1990 fuel usage, the fuel usage would have been approximately zero. The improbability of that scenario lead the inventory team to decide that the fuel usage from 1990 should not be estimated through regression. • Instead, the measured fuel usage for 1999 was simply used for the years 1990 to 1999, with the recognition that this was likely an overestimate. Greenhouse Gas Inventory - Duke University
Source Details: Transportation Biodiesel • Because Duke only began using biodiesel in its diesel fleet at the tail end of fiscal year 2003, the mitigation benefits of biodiesel are not evident in the current inventory. • When the 2004 fiscal year closes, it is expected that Duke’s use of a 20% biodiesel blend will contribute a 35% reduction in GHG emissions from the diesel fleet, which represents a 10% reduction in the entire fleet’s emissions. Greenhouse Gas Inventory - Duke University
Source Details: Transportation Employee commuter miles • Commuter emissions are by far the largest source of Duke’s transportation related emissions measured in this inventory. • Using an anonymous list of employee addresses and Geographic Information Systems software, we were able to determine the straight-line distance from home to campus for each employee. The average distance was 15 miles. We multiplied that distance by 2 trips a day and 225 work days in the year. • Human Resources was only able to provide a list of employee addresses for the 2003 fiscal year. HR said it would be highly difficult if not impossible to provide a list for each year from 1990. Unfortunately, that means our inventory was unable to capture the effects of suburbanization on commute distances that have been measured at area institutions, such as UNC-CH. • The straight-line nature of our travel distances represents a large underestimate of the actual road miles and driving conditions that would effect fuel economy. Greenhouse Gas Inventory - Duke University
Source Details: Transportation Employee commuter miles - Continued • Measured mode share data is not available at Duke. (Mode share indicates what percentage of commuters use various modes of transportation: cars, bus, carpool, bike, walk) • In place of measured mode share data we used estimates based on common mode shares at other campuses and area institutions. We assumed that 95% of faculty and 85% of staff either drive their own car to campus or are dropped off and picked up by a friend or family member. That leaves a small percentage of bicyclists, carpoolers and bus riders. • The lack of mode share data is a major source of inaccuracy in our inventory and must be resolved with a combination of commuter surveys and travel journals. Greenhouse Gas Inventory - Duke University
Source Details: Transportation Student commuter miles • No data was entered into the inventory for student travel habits because no reliable analysis of student travel habits exists. Factors would be short and extended trips off-campus for work, pleasure or school. This could perhaps be estimated through a combination of surveys and travel journals. • It may be possible to inventory the emissions related to travel between a student’s family home and school at the start and end of each semester. This would be very difficult to do for past years, but perhaps should be done for each fiscal year moving forward. Greenhouse Gas Inventory - Duke University
Source Details: Transportation Air Travel • Air travel is the most greenhouse gas intensive form of transportation because it releases large amounts of gas into the upper atmosphere where it is unlikely to be readily absorbed. • The only air travel captured by the inventory is athletic team travel, which was available beginning in 2003. • Faculty and staff air travel was not available because flight bookings are done individually with no central data collection repository. Greenhouse Gas Inventory - Duke University
Source Details: Transportation Greenhouse Gas Inventory - Duke University
Source Details: Duke Forest • With the help of the Nicholas School, it was estimated that the Duke Forest absorbs approximately 8,000 metric tons of CO2 each year. • Considering Duke Forest is 7,900 acres, that is essentially means the each acre of the Duke Forest absorbs 1 metric ton each year. • Interestingly, the EPA estimates that it only takes 1/3 of an acre of forest to absorb 1 metric ton each year. The discrepancy may result from a difference in the biological make-up of the forests studied or reflect newer science. • Assuming our estimation is correct, the Duke Forest absorbs an amount of CO2 equivalent to the average emissions of 1,746 cars in a year. Greenhouse Gas Inventory - Duke University
Trends These two charts show that the energy efficiency of construction post-1999 slightly reduced the whole University’s emissions per square foot. This would be a good trend to continue. Greenhouse Gas Inventory - Duke University
Trends Energy Management • Beginning in 1996, Facilities Management Department’s Energy Management Team implemented 46 energy efficiency projects. The reduction in energy use generated by those projects can be seen in the inventory where the emissions plateau from 1995 to 2000 before resuming their upward trend. • The red line estimates where our emissions would be now were the pre-1996 trend to have continued. The blue line represents the trend over the whole 13 year period, and the green line represents the trend post-2000. plateau Greenhouse Gas Inventory - Duke University