Download
1 / 7
70 likes | 190 Views
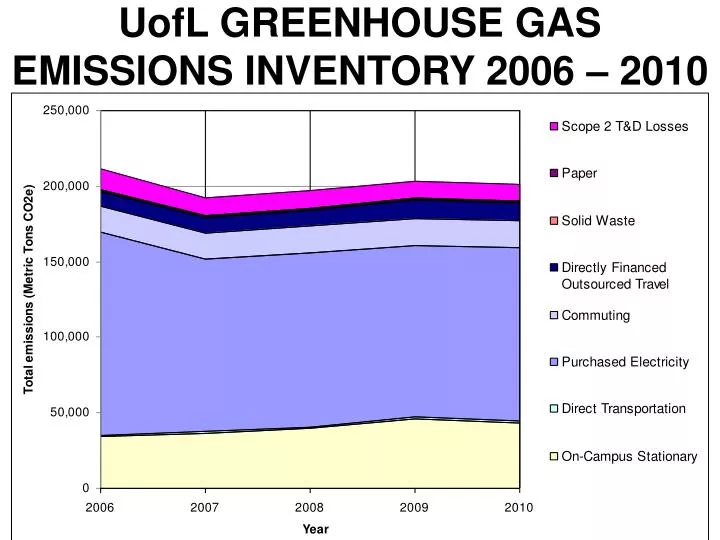
UofL GREENHOUSE GAS EMISSIONS INVENTORY 2006 – 2010. Data Limitations: As the University does not track gallons directly, fuel consumption figures had to be estimated based on an average price per gallon.

E N D
Data Limitations: • As the University does not track gallons directly, fuel consumption figures had to be estimated based on an average price per gallon. • Emissions for leased off-campus spaces and private residence hall spaces not owned by UofL were not included. • Fugitive emissions from laboratory animals used in medical research could not be accounted for. • We have yet to capture fertilizer application data for our campus landscape. • Bus commute data could only be provided to UofL without data about transfers. • Air miles booked on behalf of the University but not using the University’s contracted travel agent could not be directly accounted for. • Miles commuted by car to campus were estimated based on the assumption that those who bought parking permits were driving an average round-trip distance from their home zip code at a rate of five times per week for employees and three times per week for students controlling for time-off and times between semesters. • The Athletics department’s transportation fuel usage, fertilizer applications and emissions resulting from Athletic events (other than utilities usage) were not incorporated into this report due to its separate budget and accounting system. • Wastewater volume is not measured, nor is freshwater input as the water utility does not provide the University with annualized gallon data.