Download
1 / 2
20 likes | 77 Views
Temperature. 10. 15. 20. 25. 30. Atmospheric Pressure. 1003. 1005. 1010. 1011. 1014. Calculating Linear Regressions (y = ax + b) on Calculators. Correlation Coefficient: 0.982607368. For TI-83 Plus: Enter data in 2 lists Exit lists and then press STAT

E N D
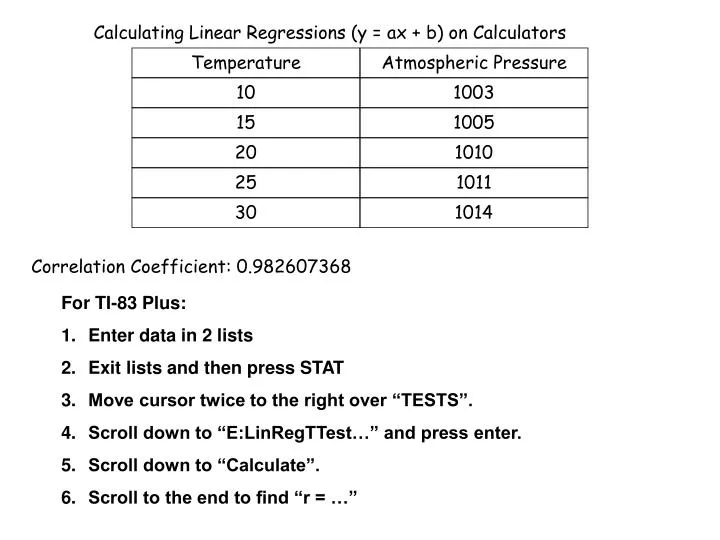
Temperature 10 15 20 25 30 Atmospheric Pressure 1003 1005 1010 1011 1014 Calculating Linear Regressions (y = ax + b) on Calculators Correlation Coefficient: 0.982607368 • For TI-83 Plus: • Enter data in 2 lists • Exit lists and then press STAT • Move cursor twice to the right over “TESTS”. • Scroll down to “E:LinRegTTest…” and press enter. • Scroll down to “Calculate”. • Scroll to the end to find “r = …”
Temperature 10 15 20 25 30 Atmospheric Pressure 1003 1005 1010 1011 1014 Calculating Linear Regressions (y = bx + a) on Calculators Equation of regression line: y = 0.56x + 997.4 • For TI-83 Plus: • Enter data in 2 lists • Exit lists and then press STAT • Move cursor once to the right over “CALC”. • Scroll down to “8:LinReg(a+bx)” and press enter twice. • A is the y-intercept and b is the slope of the regression line