Download
1 / 26
260 likes | 373 Views
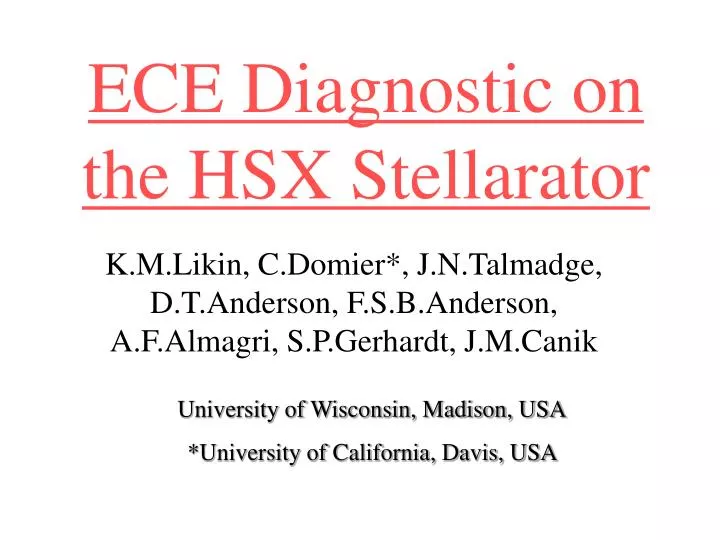
ECE Diagnostic on the HSX Stellarator. K.M.Likin, C.Domier*, J.N.Talmadge, D.T.Anderson, F.S.B.Anderson, A.F.Almagri, S.P.Gerhardt, J.M.Canik. University of Wisconsin, Madison, USA *University of California, Davis, USA. Introduction.

E N D
ECE Diagnostic on the HSX Stellarator K.M.Likin, C.Domier*, J.N.Talmadge, D.T.Anderson, F.S.B.Anderson, A.F.Almagri, S.P.Gerhardt, J.M.Canik University of Wisconsin, Madison, USA *University of California, Davis, USA
Introduction A single spatial channel conventional radiometer is used for detection of the electron cyclotron emission (ECE) from the HSX plasma. The HSX plasma built-up followed by is made by microwave power (up to 200 kW) at 28 HGz that corresponds to the second harmonic of wce at 0.5 T. The experiments are carried out under (0.5 – 3)*1012 cm-3 of the mean plasma density and (0.4 – 1) keV of the central electron temperature [1]. To evaluate the optical depth of HSX plasma, the spatial resolution and the radiation temperature profile the ray tracing code developed for ECRH in the HSX geometry has been modified so that it can serve the ECE diagnostic [2]. Both emission and absorption terms are taken into consideration. The available HSX ports have been examined to place the ECE antenna for the optimum sight. The wave beam width, its divergence and the sight angle can be adjusted to get maximum optical depth and spatial resolution.
ECE in the Box Port Mod |B| and plasma boundary Ray traces f = 0 degs. • Advantages: • • Good access to the plasma • • Small wave beam refraction • Good spatial resolution • • Measurements at both low and high field sides Z,m Z, m • Disadvantages • Low optical depth under a moderate electron temperature R,m Bo = 0.5 Tne(0) = 3*1012 cm-3; R, m
a) c) b) d) Radiated power profile and optical depth at different frequencies versus the major radius (a,b) and effective plasma radius (c,d) under Bo = 0.5 T; ne(0) = 3*1012 cm-3;ne(r) = ne(0)*(1- r2); Te(r) = Te(0)*exp(-2*r2) Optical Depth in the Box Port
a) c) b) d) Radiated power profile versus the major radius (a,b) and versus the effective plasma radius (c,d) under Bo = 0.5 T (a,c); Bo = 0.49 T (b,d), respectively;ne(0) = 3*1012 cm-3; Te(0) = 0.4 keV; ne(r) = ne(0)*(1- r2); Te(r) = Te(0)*exp(-2*r2) Inward Resonance
ECE in the 6” Top Port f = 18.1 degs. Mod |B| and plasma boundary Ray traces Z,m Z, m R,m R, m Bo = 0.5 T; ne(0) = 3*1012 cm-3; • Advantages: • • Good access to the plasma • High optical depth • Disadvantages • High wave beam refraction • Poor spatial resolution under high plasma densities • Measurements at down shifted frequency only
a) c) d) b) Radiated power profile and optical depth at different frequencies versus the major radius (a,b) and versus the effective plasma radius (c,d) in the 6” top port under Bo = 0.5 T; ne(r) = ne(0)*(1- r2); Te(0) = 0.4 keV; Te(r) = Te(0)*exp(-2*r2) Optical Depth in the 6” Top Port
ECE at the High Field Side f = 37.8 degs. Mod |B| and plasma boundary Ray traces Z, m Z, m R, m R, m • Disadvantages • High refraction • One side measurements at up shifted frequencies • Small port diameter Bo = 0.5 T ne(0) = 3*1012 cm-3 • Advantages: • • Small magnetic field gradient • Moderate optical depth
a) b) Radiated power profile and optical depth versus the major radius (a) and versus the effective plasma radius (b) in the high field side port under Bo = 0.5 T; ne(0) = 3*1012 cm-3; ne(r) = ne(0)*(1- r2); Te(0) = 0.4 keV; Te(r) = Te(0)*exp(-2*r2) Optical Depth at the High Field
Description of the radiometer The radiometer is a heterodyne type receiver [5]. Radiation from the plasma, over a frequency range of 25-31 GHz, is collected by a horn antenna (Millitech Model SGH-28, with a nominal 25 dB of gain at the axis) and after a notch filter it applies to a broadband balanced mixer. A Gunn diode (21 mW at 42.5 GHz) is used as a local oscillator. The 11.5-17.5 GHz IF signals from the mixer (4.3-7.5 dB conversion loss) are amplified by a low noise microwave amplifier (model JCA1218-F01, 22 dB gain), bandpass filtered (center frequency may be varied from 11.5 to 17.5 GHz) and amplified once more (model C060180G-4F1, 32 dB gain). Conventional IF modules incorporate wideband detectors which are coupled to two stage (100X gain, 20 kHz) video amplifiers.
Z B e w = w n n ce B ~ 1/R z Y X R Plasma R 0 Vacuum Vessel ECE Radiometry The gyromotion of electrons results in the Electron Cyclotron Emission (ECE) at a series of discrete harmonic frequencies: When the plasma is optically thick, the ECE radiation intensity is the black body intensity:
MD_3 MD_2 MD_1 P = 50 kW ecrh MD_4 MD_5 MD_6 ECE antenna Location of the ECE antenna
12 - 18 GHz High Pass Filter 15.5 GHz Band Pass Filter Horn Antenna Diode Mixer Video Amplifier 27 GHz Low Pass Filter Video Detector Amplifier: 32 dB gain +18 dBm 3.5 dB NF Amplifier: 22 dB gain +10 dBm 3 dB NF Data Acquisition System Gunn diode: 42.5 GHz 21 mW Radiometer set-up
Gyrotron power leakage test First test of the notch filter on HSX operation with 50 kW of launched power showed that the gyrotron leakage power through the filter is 3 mW with a peak at the gyrotron leading front (it is greater by factor of 3 in power).
Low Pass Filter To reduce the gyrotron leakage power a lowpass filter is suggested to use. The filter consists of a pair of K-band lowpass filters (HP model K362A), in which the cut-off frequency has been lowered by the insertion of carefully cut sections of dielectric strips within the filter, coupled with a K and Ka band transition. Also shown on the Fig. are three shaded areas which represent available IF bandpass filter. Gyrotron power leakage through the filter in HSX operation is about 0.8 mW in a lack of absorption and drops down to 0.03 mW when the absorption is high.
Raw ECE signal and Te The calibration of the radiometer demonstrated its temperature response to be ~ 400 eV/V. In terms of a noise level the sensitivity of radiometer is 2 eV The estimated electron temperature at plasma radius of 0.6 is 250eV.
Raw ECE Signals Low plasma density ne = 0.5*1012 cm-3 Moderate plasma density ne = 1.5*1012 cm-3 The higher level in radiated power at low plasma density is supposed due to superthermal electron emission.
ECH Absorption The absorption of heating microwave power is measured with a set of microwave diodes installed around the machine. The raw signals are shown in the following figures. ne = 0.5*1012 cm-3 ne = 1.5*1012 cm-3 ne = 3*1012 cm-3 In the QSH magnetic field configuration the heating microwave power is absorbed with high efficiency (about 90%) in a few passes through the plasma column.
Off-axis Resonance Central resonance Bo = 0.5 T Resonance shifted inward Bo = 0.49 T The radiated temperature drops under off-axis heating because of flattening of electron temperature profile and reduction of superthermal electron population.
ECE Signal Decay After the heating microwave power turn-off the decay rate of radiated temperature is about 1.7 msec. while the plasma density is slightly increased.
Plasma Temperature Profile Taking the real plasma density profile and assuming some electron temperature profile one can find an optical depth running the ray tracing code. For mean plasma density of 1.5*1012 cm-3 and the central electron temperature of 300 eV the optical depth is 0.5. Taking into account this value the electron temperature has been estimated for two spatial locations (the data were taken at 27 GHz and 26.2 GHz using two different band pass filters ). Temperature profile: Te(r) = Te(0)*exp(-3*r2)
Conclusion • Optical depth and radiated power profile in the HSX plasma can be evaluated with the ray tracing code in 3-D geometry. • Three different locations for ECE antenna have been examined. The best access to the plasma is on the box port while an ECE antenna in the 6” top port can be a challenger as well. • The notch and low pass filters have been tested on a gyrotron power leakage and it was found that the low pass filter has the suitable attenuation at 28 GHz. • The radiometer has been calibrated with a hot load at the UC-Davis and installed at the HSX. • First measurements exhibit about 270 eV of electron temperature at the plasma radius of 0.2 at ne = 1.5*1012 cm-3
References. • D.Anderson. HSX: Helically Symmetric Experiment. Progress Report and Renewal Proposal. 2001. • K.Likin, B.D.Ochirov. Sov.J.Plasma Phys. 18 (1992), 42. • M.Bornatici, R.Cano, O.De Barbieri, F.Engelman. Nucl.Fusion, 23 (1983), p.1153. • H.J.Hartfuss, T.Geist, M.Hersch. Plasma Phys. & Control. Fusion, 39 (1997), pp.1693-1769. • M.Bornatici, F.Engelman. Phys. Plasmas, 1 (1992), pp.189-198. • G. Cima et al., Phys. Plasmas 2, 70 (1995). • V.L.Ginzburg. Propagation of electromagnetic waves into plasma. Nauka, Moscow,1967.