Download
1 / 17
170 likes | 290 Views
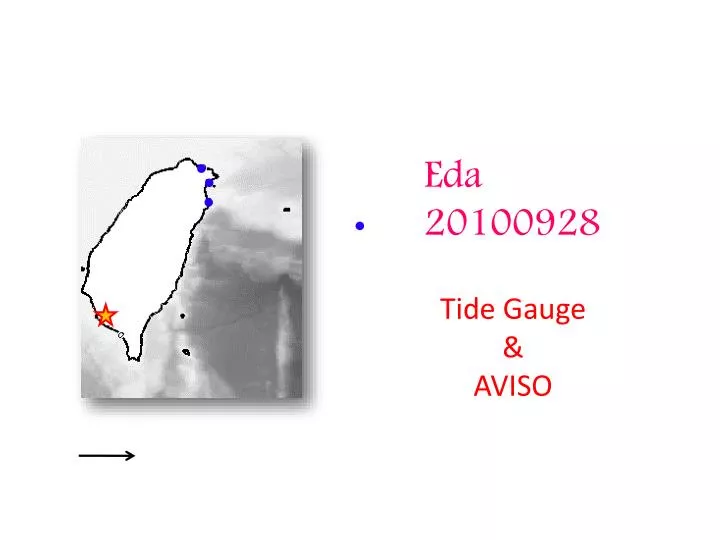
Eda 20100928 Tide Gauge & AVISO. Mean SSH from Rio et al.2009 Black dots are the locations of the tide gauge stations. Blue contours are the isobaths. Time period of data Keelung: 1980-2009 Ishigaki : 1969-2008 Gangfeng : 1997-2007 Suao : 1999-2005 Lanyu:1992-2009 Dawu:2004-2009.

E N D
Eda 20100928 Tide Gauge & AVISO
Mean SSH from Rio et al.2009 Black dots are the locations of the tide gauge stations. Blue contours are the isobaths. Time period of data Keelung: 1980-2009 Ishigaki: 1969-2008 Gangfeng: 1997-2007 Suao: 1999-2005 Lanyu:1992-2009 Dawu:2004-2009
SST (color), SLP (contours) and wind stress (arrows) anomalies during +ve and –ve PDO’s +ve -ve
PDO leads tide gauge 11 months. Corr.Coef. ~0.47
Mode 1 + 2 37.9% Wind stress curl leads ~ 1 year Corr. Coef.~0.5
Wind stress curl leads PDO 3 month. Corr.Coef. ~0.75
Re-do EOF almost identical
1 0 2
1 0 2 Near the S. center of the WP index.
PDO leads tide gauge 11 months. Corr.Coef. ~0.47 EkConv & PDO correlate So EkConv also leads TG EkConv = Ekman Convergence Fig.10b of Qiu & Chen, 2010, JPO, 213-225.